Lines drawn decades before the crash, and what markets did at them.
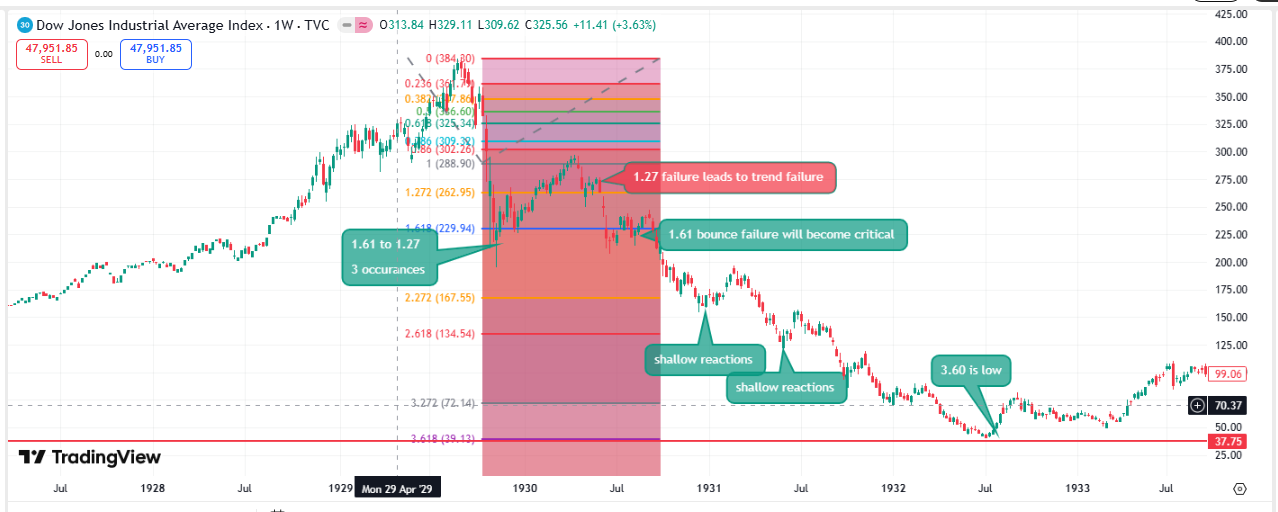
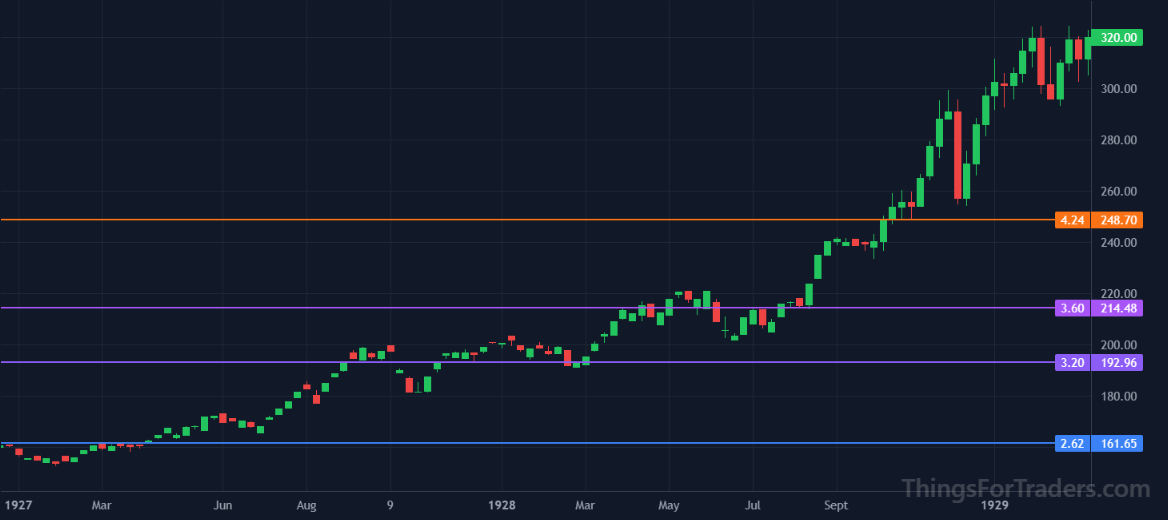
In 1929 the Dow topped at 386.1, about 1.2% short of the 6.854 extension (390.6) of a swing measured from 1896, then fell 89%. This is the short version of the thesis, across 140 years.
Read the full study →You might think this is numerology. Here is what we found.
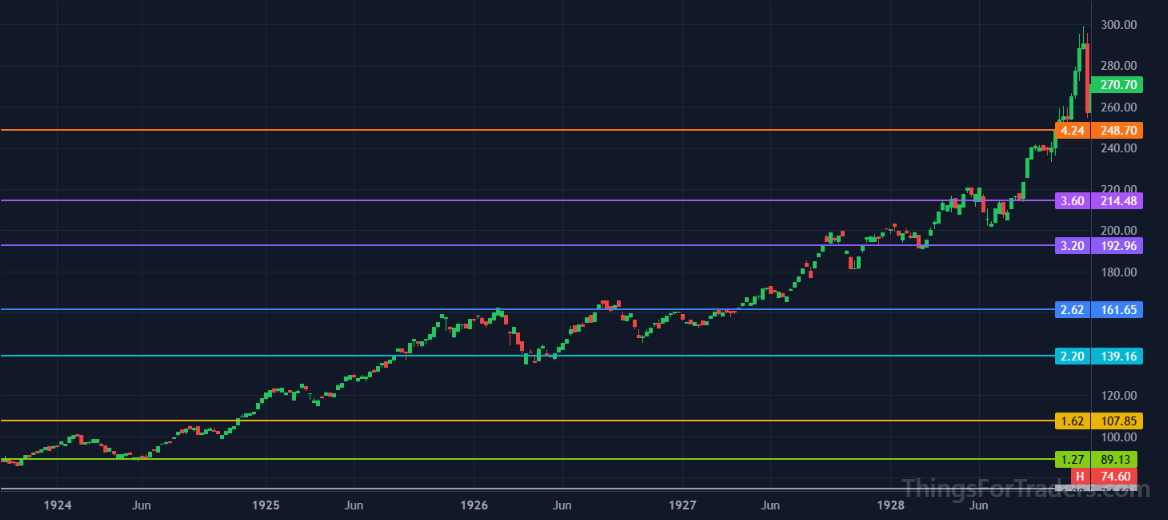
These levels aren't mysticism. Our own re-tests do not show that they appear only on linear charts: on 31 hand-drawn anchors, linear and log tie (linear nearer in 15, log in 16).
The Fibonacci Disconnect →"News drives markets, not numbers." Here is what the record shows.
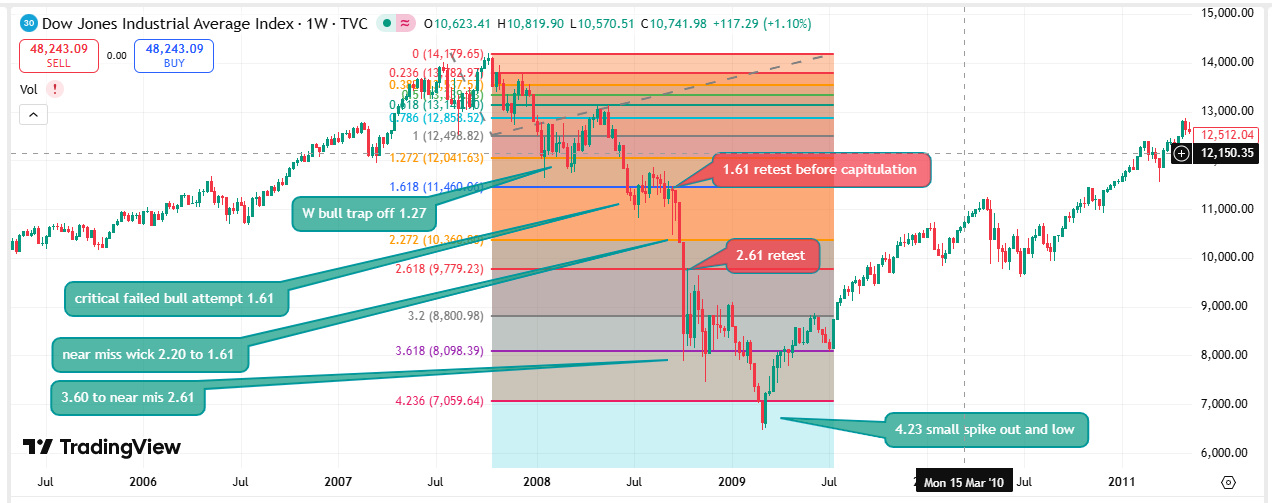
Across a century of crashes, scored against a coverage baseline, the lows land near a ladder level 63% of the time against 53% by chance, which is not statistically significant: the tests do not show the lines beat chance.
Signals before the bust →One ladder, built from the Dow's first breath.
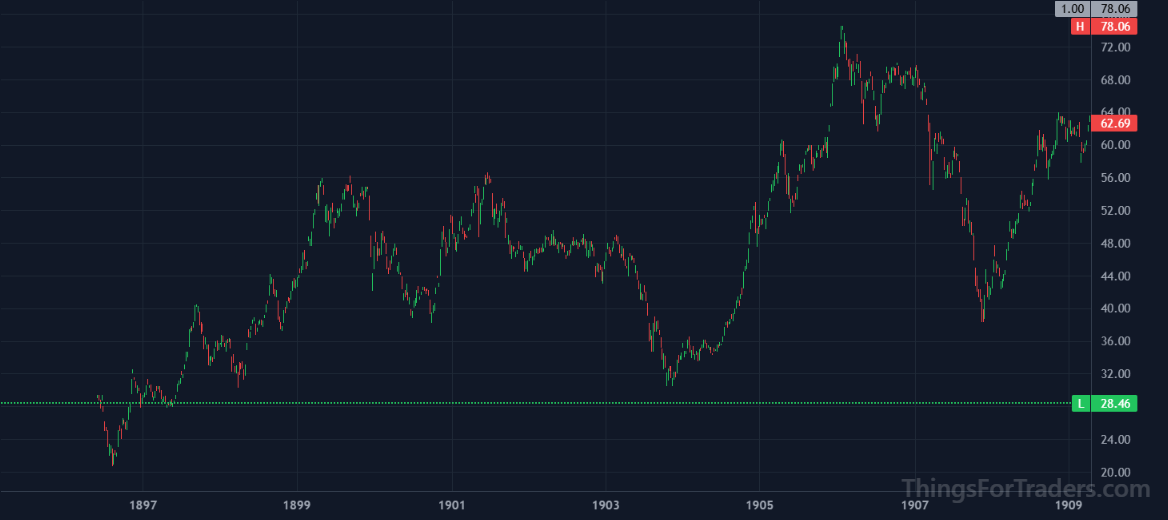
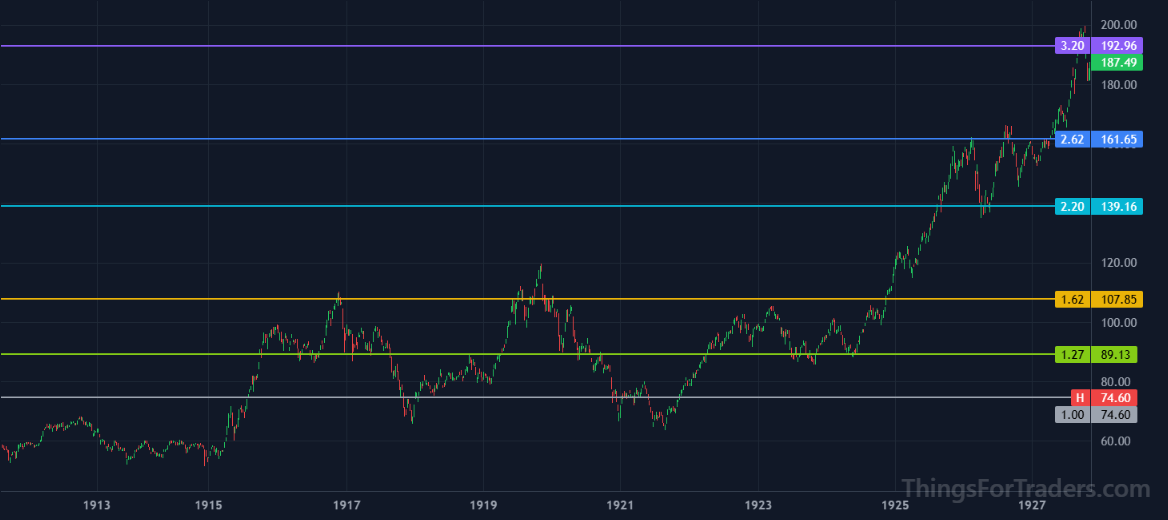
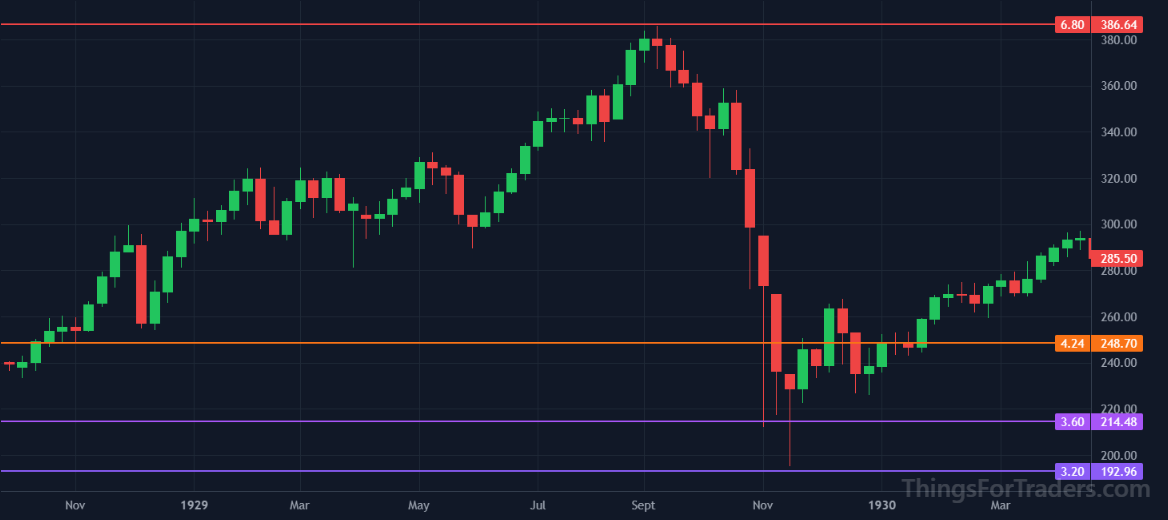
Anchor one swing from 1896, project the Fibonacci extensions, and the Dow climbs the rungs in order — 1.618, 2.618, 3.618 — tags 4.236 in 1928, and tops in September 1929 about 1.2% short of the 6.854. The ladder is computed from the 1896 swing alone; the anchor itself was picked with the whole history in view.
The inception swing →The 6.8 region has been reached in only three Dow cycles in a century.
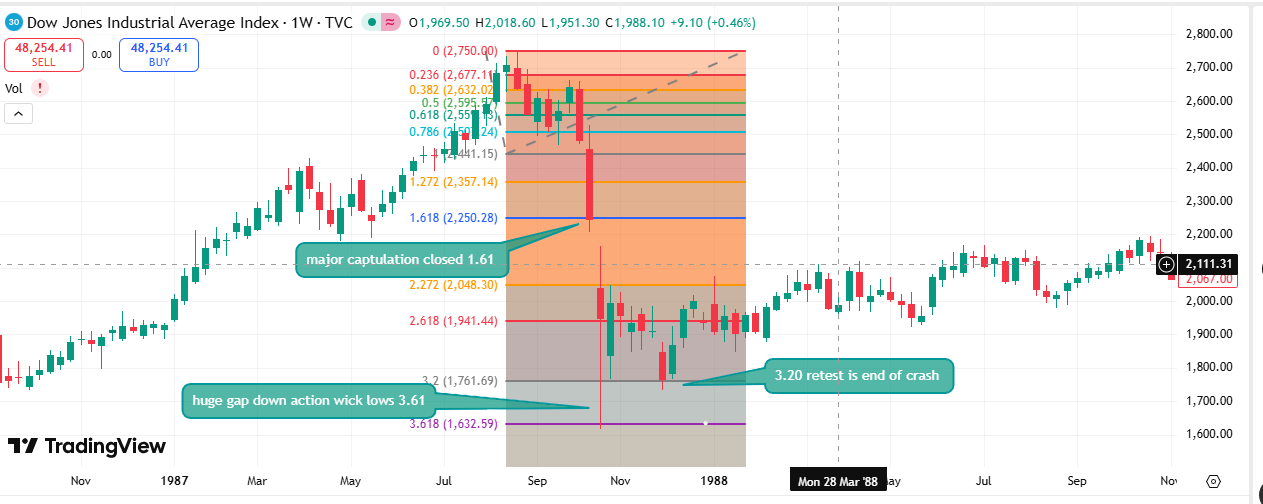
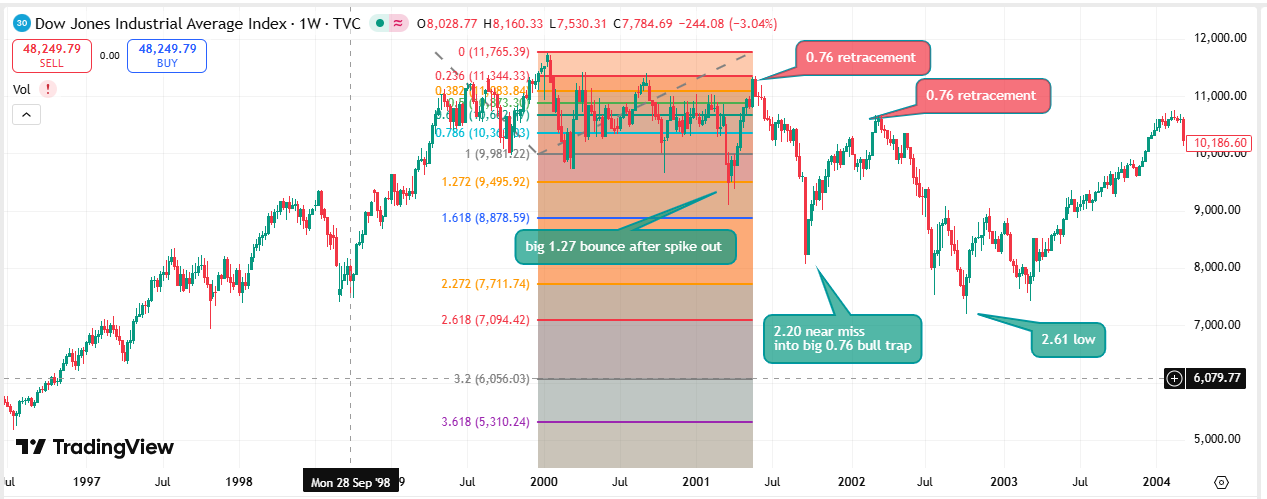
Roll the anchor forward and the 6.8 region reappears near each generational top: 1929, 1987, and the 2000 dot-com peak. Only 1929 turned at it, about 1.2% short; the 1987 top came about 14% above its 6.8 and the 2000 high about 38% above. Three cycles is too few to call that a rule.
Rolling-anchor validation →38 Dow declines. 140 years. Measured against the extension ladder.
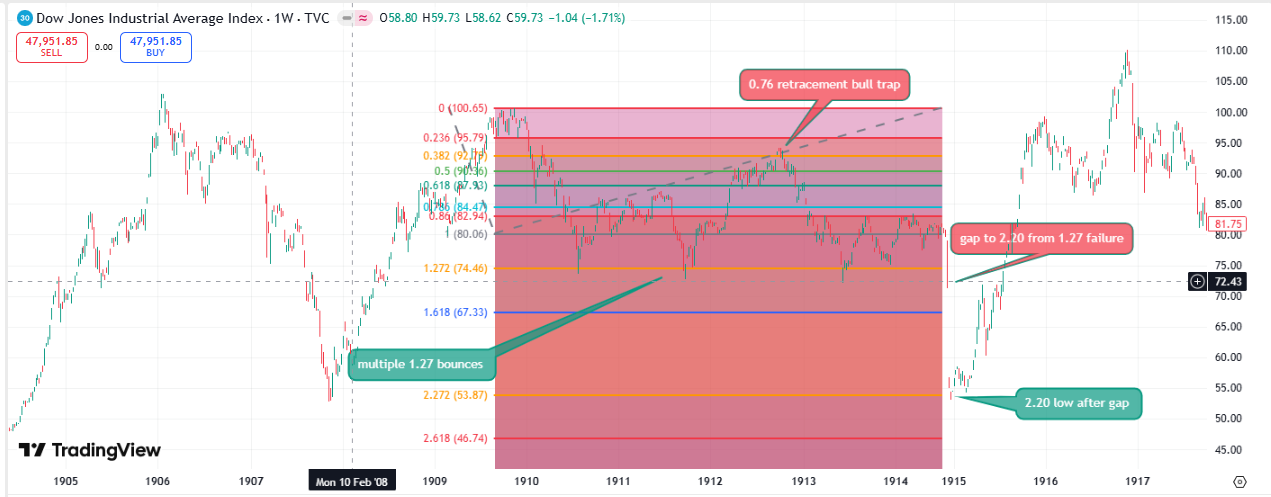
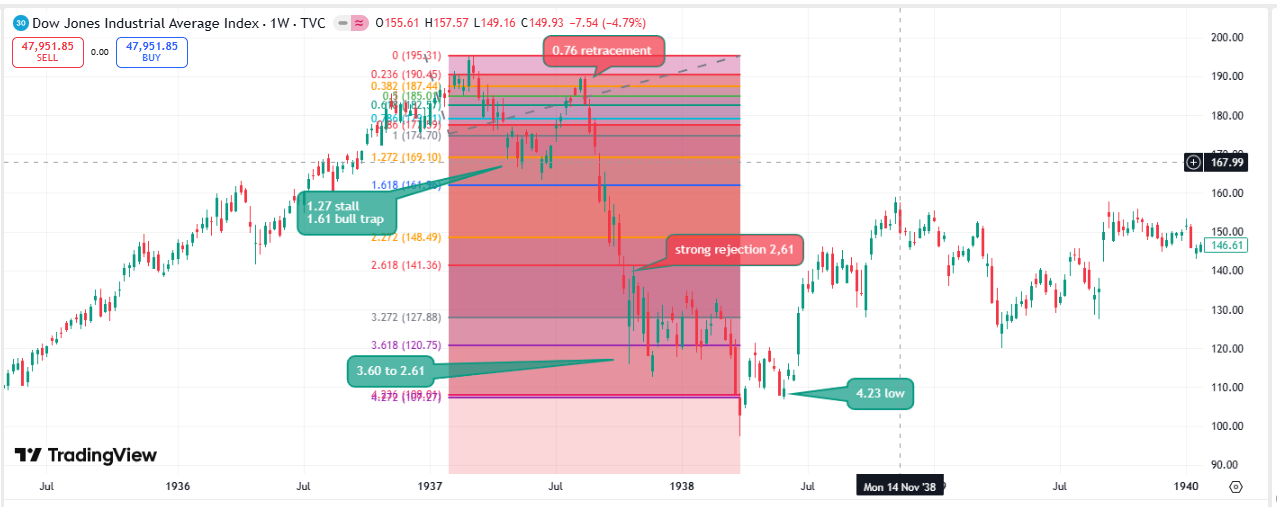
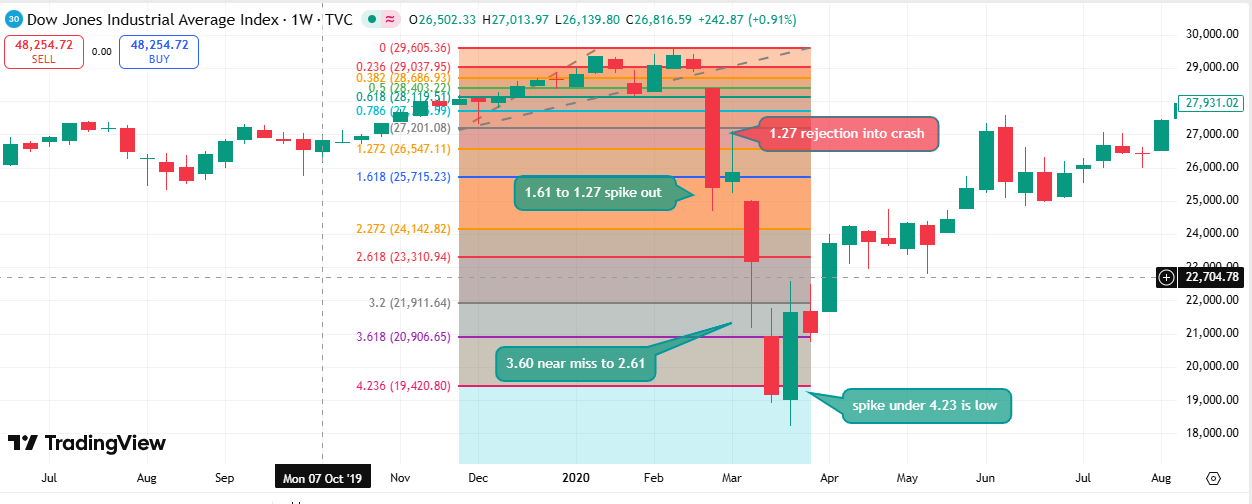
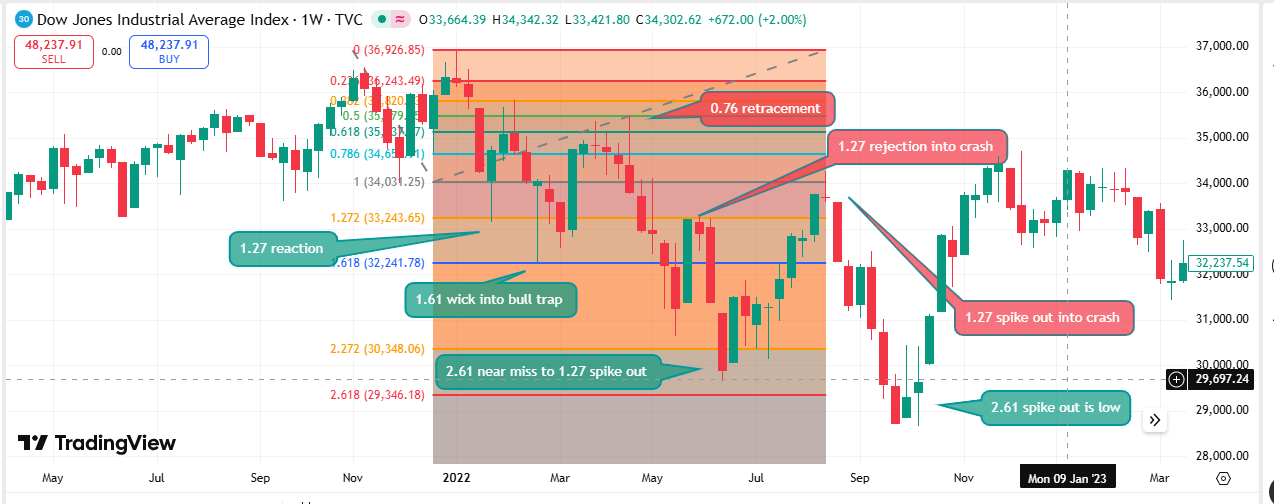
Scored against a coverage baseline, the crash lows land near a ladder level 63% of the time against 53% by chance, which is not statistically significant, and the ladder's exact ratios do no better than arbitrary ones placed similarly. The headline figure this card used earlier, and the claim that the rate rose era by era, were withdrawn after re-testing.
All 140 years →Three systemic crises, one region of the ladder.
In the crash study, the declines tied to systemic crises (1937, 2000–02, 2008) ended in the 4.236 region of their topping swings, on the study's anchors. That is a pattern in a small record, not a tested rule.
The terminal-level study →The S&P has gone through the fourth one.
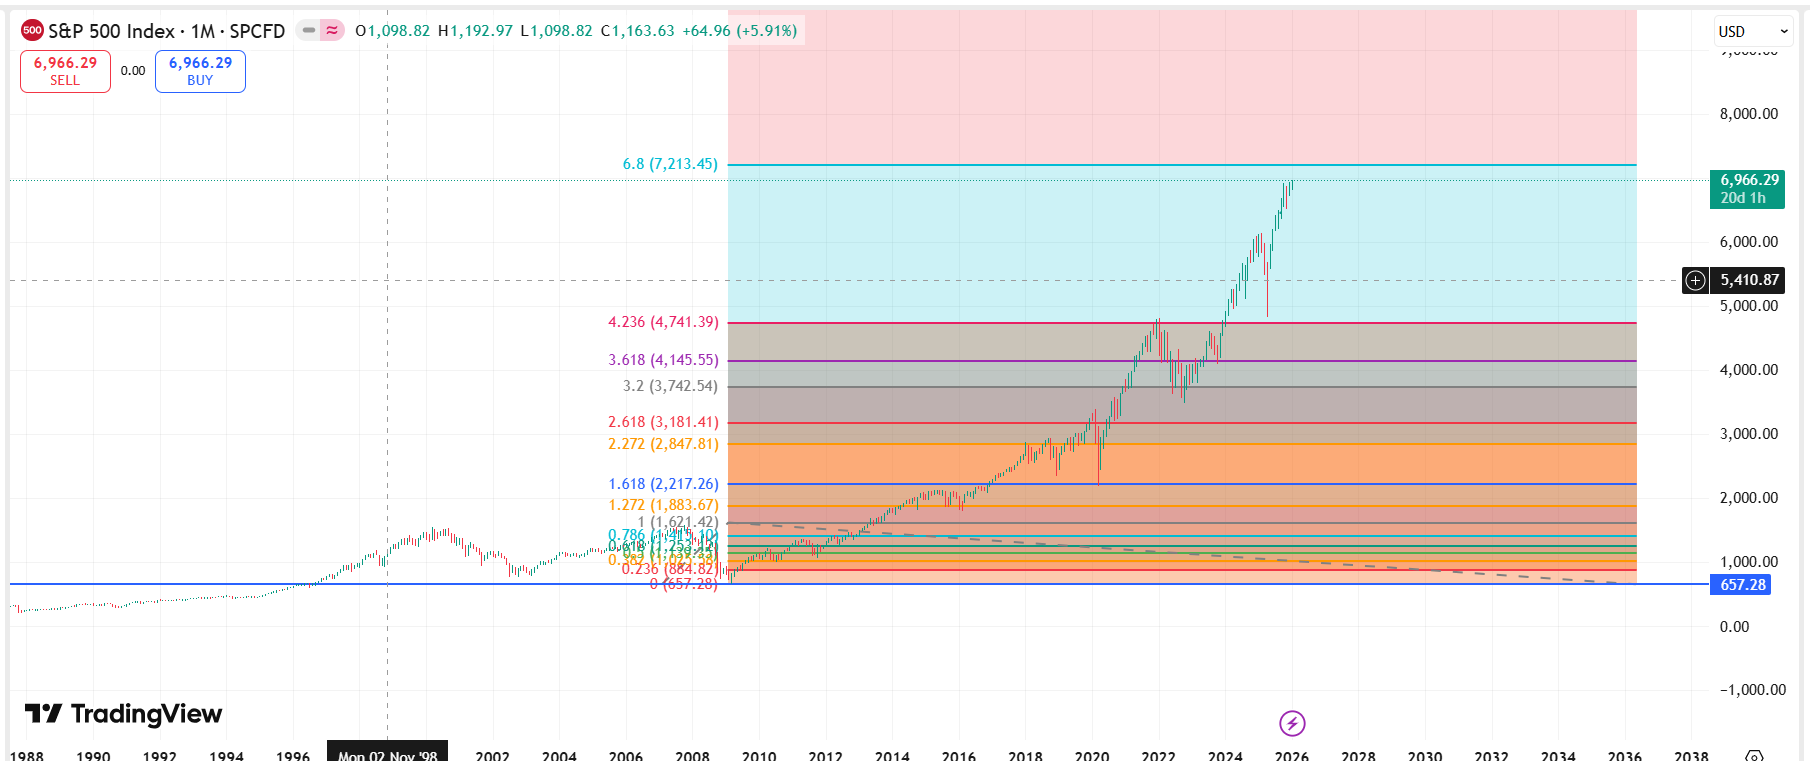
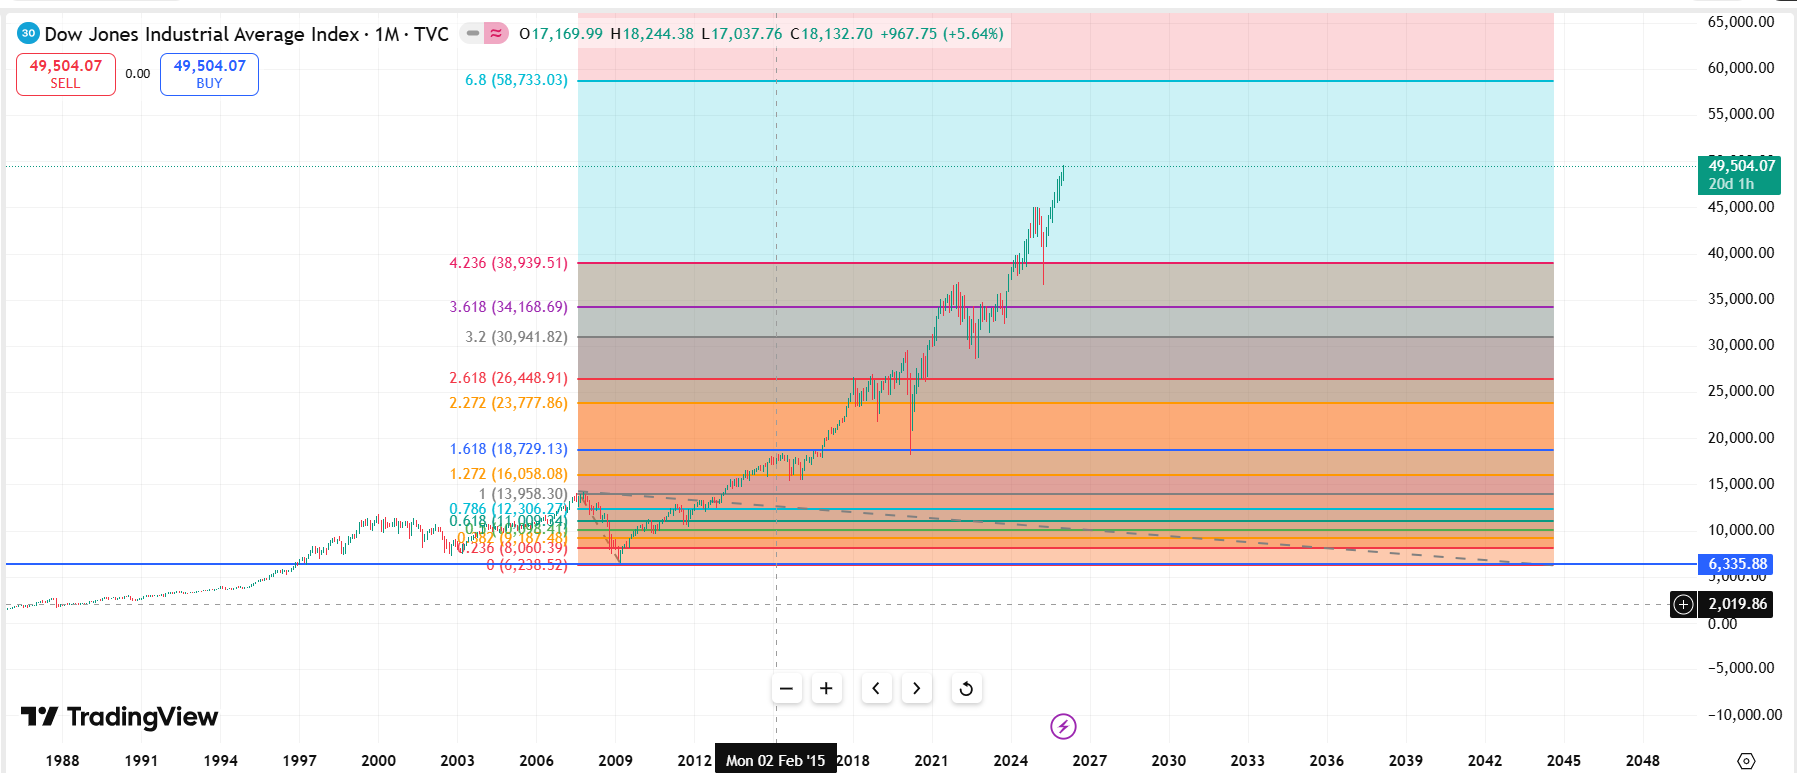
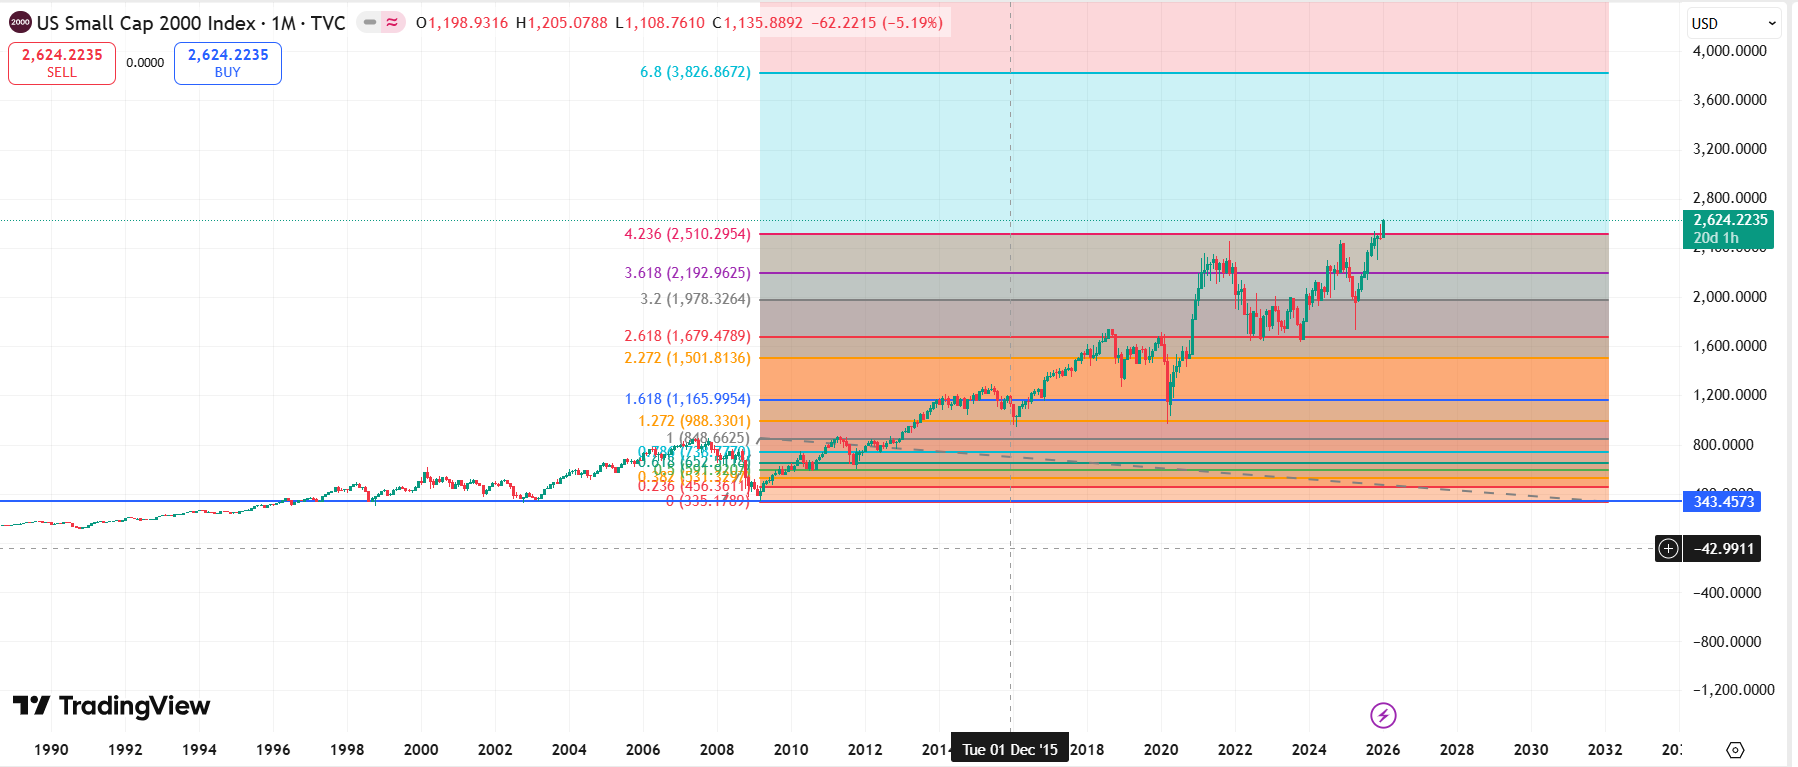
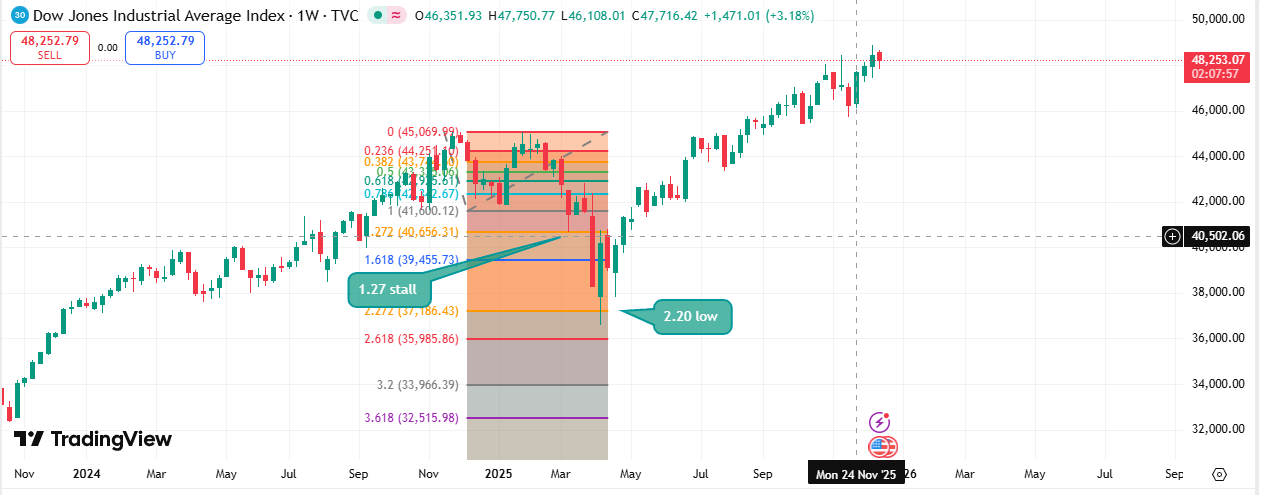
The same model, run on the 2008 low, puts the 6.8 near S&P 6,900. It first traded there on 27 October 2025, fell back to 6,317 on 30 March 2026, and has closed above it since 13 April 2026: as of 1 October 2026 it closed at 7,666, about 7.7 on the same ladder, after a high of 7,817 on 13 August. The level comes from the 2007–2009 swing, so it was fixed in 2009; the thesis pages mapping it are dated January 2026. As of 1 October 2026 the Dow (5.8) and Russell 2000 (4.8) haven't reached theirs — a divergence the framework expects.
We are not calling a top. The level was on the map in advance.
Where we are on the map →Not a crystal ball. Here are the limits.
This is not deterministic and not prescriptive. The model gives levels and likely behaviour — not timing; it can be structurally right and months early. Roughly a third of the crash lows studied miss the ladder, and the share that lands on it is not significantly above chance. False breakouts happen. We publish our own failure modes, because a framework you can't break isn't a framework — it's a sales pitch.
Risks & caveats, in full →See it for yourself.
All of it is free. The deep work is public; the live calls are a free account away.