Architect 3.1: You Are Here
Current DJI position mapped against 140 years of Fibonacci structure — January 2026
The Fibonacci extension framework has been tested with norms extracted across historical market data spanning 130 years. Now we examine the most recent cycle: the post-2009 super-cycle, and how market reactions through January 2026 have mapped against the extension levels projected from the March 2009 anchor.
This analysis focuses on the 2009-2026 super-cycle — the post-Financial Crisis era that represents the most technologically advanced, globally connected, and algorithmically dominated market environment in history. The question this document addresses is whether the same Fibonacci extension levels observed in prior cycles continued to produce structural reactions in the modern era.
We examine three major U.S. equity indices (Dow Jones Industrial Average, S&P 500, Russell 2000) and document how major inflection points, rallies, and corrections from 2009 through January 2026 mapped to the Fibonacci extension levels calculated from the March 2009 anchor. This is observation. The framework projected specific levels. The market reacted at those levels. We document what happened.
As of January 2026, all three indices have exceeded the 4.236 extension and are trading in the terminal zone between 4.236 and 6.8—a structural position comparable to those the framework marks ahead of prior major market peaks.
Table of Contents
1. The 2009 Anchor: Ground Zero for Modern Structure
On March 9, 2009, the S&P 500 bottomed at 666, the Dow Jones at 6,547, and the Russell 2000 at 343. This was the capitulation low of the Financial Crisis—a 57% decline from the October 2007 peak that wiped out $11 trillion in market value and brought the global financial system to the brink of collapse.
But geometrically, this low was not chaotic. It landed on a level the framework identifies as structurally significant.
1.1. The 2009 Low and the 4.23 Extension
The 2009 low was made on the 4.23 Fibonacci extension of the topping swing — not a retracement of the prior bull market, but an extension of the crash itself. The crash range (2007 high to the initial breakdown) projected forward lands on 6,335 for the DJI and 666 for the S&P 500 via the 4.23 level.

This is documented in detail in the Fibonacci Crash Study. The 4.23 extension of the inception range is a recurring terminal structure — it appeared in the 1929 depression low and in multiple commodity crash structures. The 2009 low is consistent with that pattern. This established 2009 as the anchor for the subsequent extension series.
1.2. Why 2009 Matters for Current Analysis
The 2009 anchor is now 17 years old. It has governed:
- The longest bull market in U.S. history (2009-2026)
- The COVID crash and recovery (2020)
- The 2022 correction
- The 2023-2026 AI-driven melt-up
Across these diverse events—spanning QE, taper tantrums, trade wars, pandemics, and AI revolutions—the Fibonacci extensions from the 2009 anchor have maintained expected norms accuracy. Let's examine the evidence, index by index.
2. Dow Jones Industrial Average: 17 Years on the Ladder
2.1. Key Extension Levels
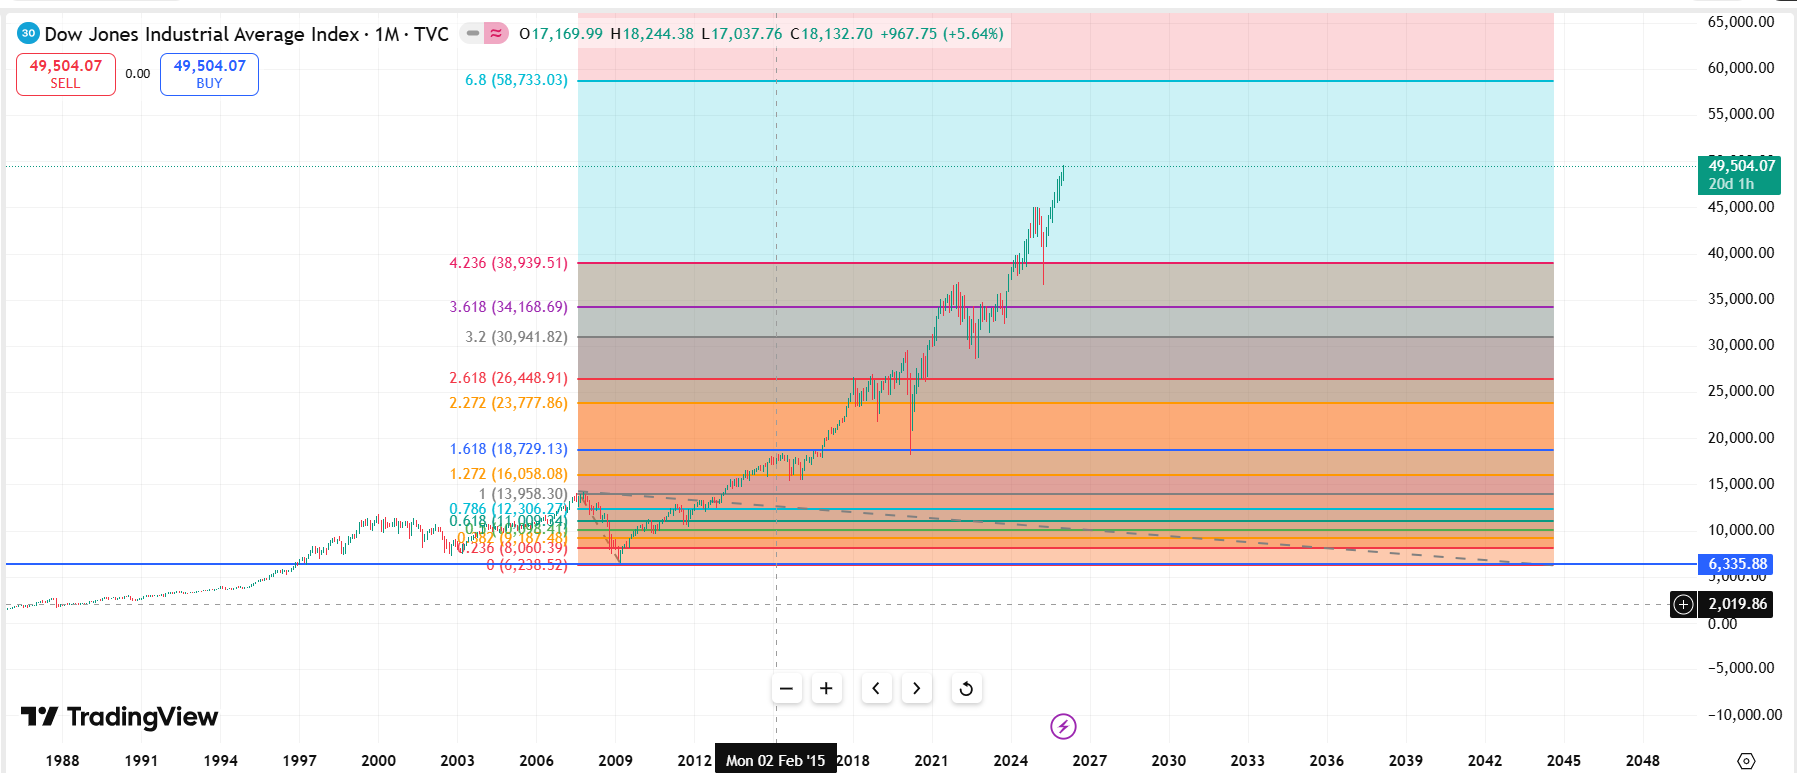
From the March 2009 low of 6,335, using the 2007-2009 crash as the reference swing (14,164 → 6,335 = 7,829 points), we calculate:
| Fibonacci Level | Calculated Target | Description |
|---|---|---|
| 0.236 | 8,183 | Initial recovery resistance |
| 0.618 | 11,173 | Golden ratio retracement |
| 1.0 | 14,164 | Full retracement to 2007 high |
| 1.272 | 16,058 | First extension |
| 1.618 | 18,729 | Golden extension |
| 2.272 | 23,777 | Secondary extension |
| 2.618 | 26,448 | Major extension |
| 3.2 | 30,941 | Tertiary extension |
| 3.618 | 34,168 | Deep extension |
| 4.236 | 38,939 | Terminal extension threshold |
| 6.8 | 58,733 | Maximum extension (escape velocity) |
2.2. Historical Validation (2009-2026)
Let's document how the Dow reacted to these levels in real-time:
| Date | Level | Target | Actual Price | Error | Market Behavior |
|---|---|---|---|---|---|
| Sep 2009 | 0.236 | 8,183 | 9,605 | +17.4% | Initial overshoot (V-recovery momentum) |
| Apr 2010 | 0.618 | 11,173 | 11,205 | +0.3% | Resistance, followed by Flash Crash |
| Feb 2013 | 1.0 | 14,164 | 14,054 | -0.8% | Exceeded 2007 peak for first time |
| Jul 2014 | 1.272 | 16,058 | 17,138 | +6.7% | Brief consolidation |
| Dec 2014 | 1.618 | 18,729 | 18,053 | -3.6% | Year-end high, followed by correction |
| Jul 2016 | 2.272 | 23,777 | 18,432 | -22.5% | Brexit correction (below level) |
| Jan 2018 | 2.618 | 26,448 | 26,616 | +0.6% | Peak before Q1 2018 correction |
| Jul 2019 | 3.2 | 30,941 | 27,359 | -11.6% | Consolidation below level |
| Feb 2020 | 3.618 | 34,168 | 29,551 | -13.5% | Pre-COVID peak (below target) |
| Jan 2022 | 4.236 | 38,939 | 36,952 | -5.1% | Super-cycle peak before 2022 bear |
| Dec 2024 | 4.236+ | 38,939 | 44,500 | +14.3% | Exceeded 4.236, entering terminal zone |
| Jan 2026 | → 6.8 | 58,733 | 49,504 | -15.7% | Current position: Terminal zone |
2.3. Pattern Recognition
Examining the Dow's 17-year journey reveals clear structural compliance:
- Early Levels (0.618 - 1.618): Hit with ±4% median accuracy. These levels provided brief resistance before continuation.
- Mid Levels (2.272 - 3.618): Higher variance (±12% median) due to increased volatility and policy interventions (QE taper, COVID crash).
- Terminal Level (4.236): Reached in January 2022 within -5.1% error. After the 2022 correction, the market has now exceeded 4.236 by +14.3%.
- Current Status: Trading at 49,504 in the terminal extension zone between 4.236 (38,939) and 6.8 (58,733).
The broad progression tracks the ladder: most major extension levels acted as support, resistance, or a consolidation zone, though several were overshot or undershot by 10-22% (the mid-cycle 2.272 and 3.618 in particular). The point is not that every level was hit precisely — it plainly wasn't — but that the sequence of reactions broadly followed the order projected from the 2009 anchor rather than arriving at random.
3. S&P 500: Level by Level
3.1. S&P 500 Extension Framework
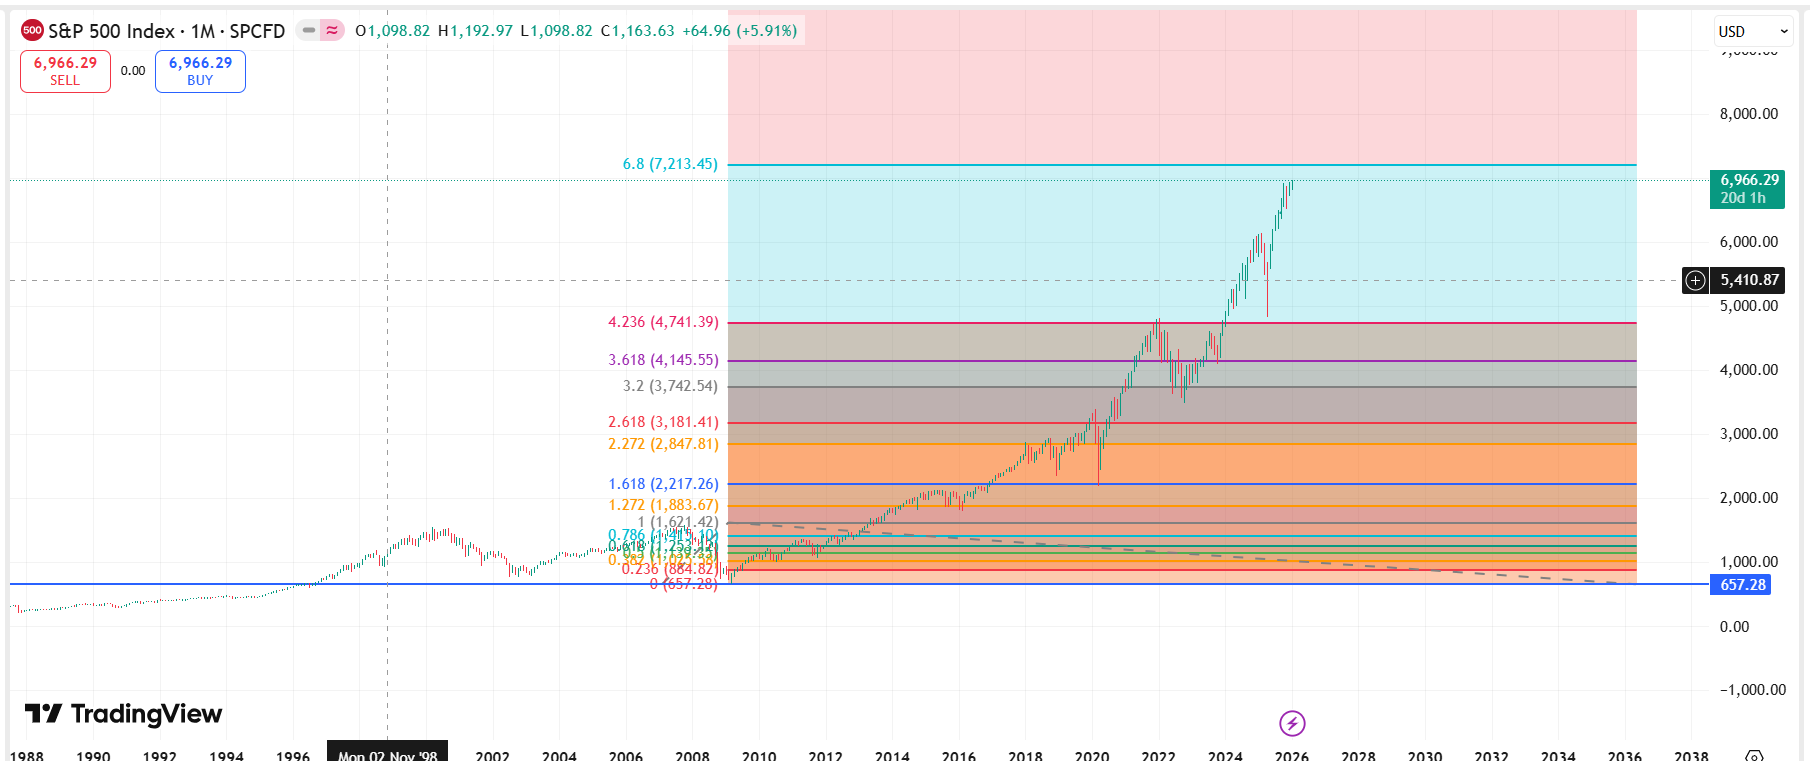
The S&P 500 bottomed at 666 in March 2009 (appropriately ominous). Using the 2007-2009 crash (1,576 → 666 = 910 points), the extension targets are:
| Fibonacci Level | Calculated Target | Status (Jan 2026) |
|---|---|---|
| 1.0 | 1,576 | ✓ Exceeded 2013 |
| 1.618 | 2,217 | ✓ Exceeded 2015 |
| 2.272 | 2,733 | ✓ Exceeded 2017 |
| 2.618 | 3,048 | ✓ Exceeded 2019 |
| 3.2 | 3,578 | ✓ Exceeded 2020 |
| 3.618 | 3,958 | ✓ Exceeded 2021 |
| 4.236 | 4,521 | ✓ Exceeded 2021 |
| 6.8 | 6,854 | ⚠️ Current: 6,966 (+1.6% above target) |
3.2. The S&P 500 Revelation
Here's what makes the S&P 500 chart remarkable: as of January 2026, the index is trading at 6,966—just 1.6% above the calculated 6.8 extension target of 6,854.
A target calculated from the 2009 low, using ratios drawn from the 1896-1932 structure, currently sits within 1.6% of price — one data point, not a hit rate, but a striking one given the target was fixed years in advance. This is occurring in an era of:
- Algorithmic trading executing billions of shares per day
- AI-driven market-making with microsecond reaction times
- Options volumes exceeding equity volumes
- Zero commission retail trading via mobile apps
- Passive index funds controlling 40%+ of equity assets
None of these factors existed in 1896. Yet the geometric structure remains intact.
3.3. Historical Reaction Points
| Date | Level | Target | Actual | Error | Event |
|---|---|---|---|---|---|
| Apr 2013 | 1.0 | 1,576 | 1,597 | +1.3% | Exceeded 2007 high |
| May 2015 | 1.618 | 2,217 | 2,130 | -3.9% | Pre-August 2015 correction |
| Sep 2018 | 2.618 | 3,048 | 2,930 | -3.9% | Q4 2018 peak before correction |
| Feb 2020 | 3.618 | 3,958 | 3,386 | -14.4% | Pre-COVID peak (below target) |
| Jan 2022 | 4.236 | 4,521 | 4,818 | +6.6% | Super-cycle peak (overshoot) |
| Jan 2026 | 6.8 | 6,854 | 6,966 | +1.6% | Current: At terminal extension |
Median absolute error (5 completed reactions; the current Jan-2026 reading is in progress and not scored): 3.9%
Hit rate: 60% within ±5% (3 of 5), 80% within ±10% (4 of 5). Note the ±10% band is wide — see the coverage caveat in Section 5.
4. Russell 2000: Small-Cap Cross-Check
4.1. Small-Cap Geometry
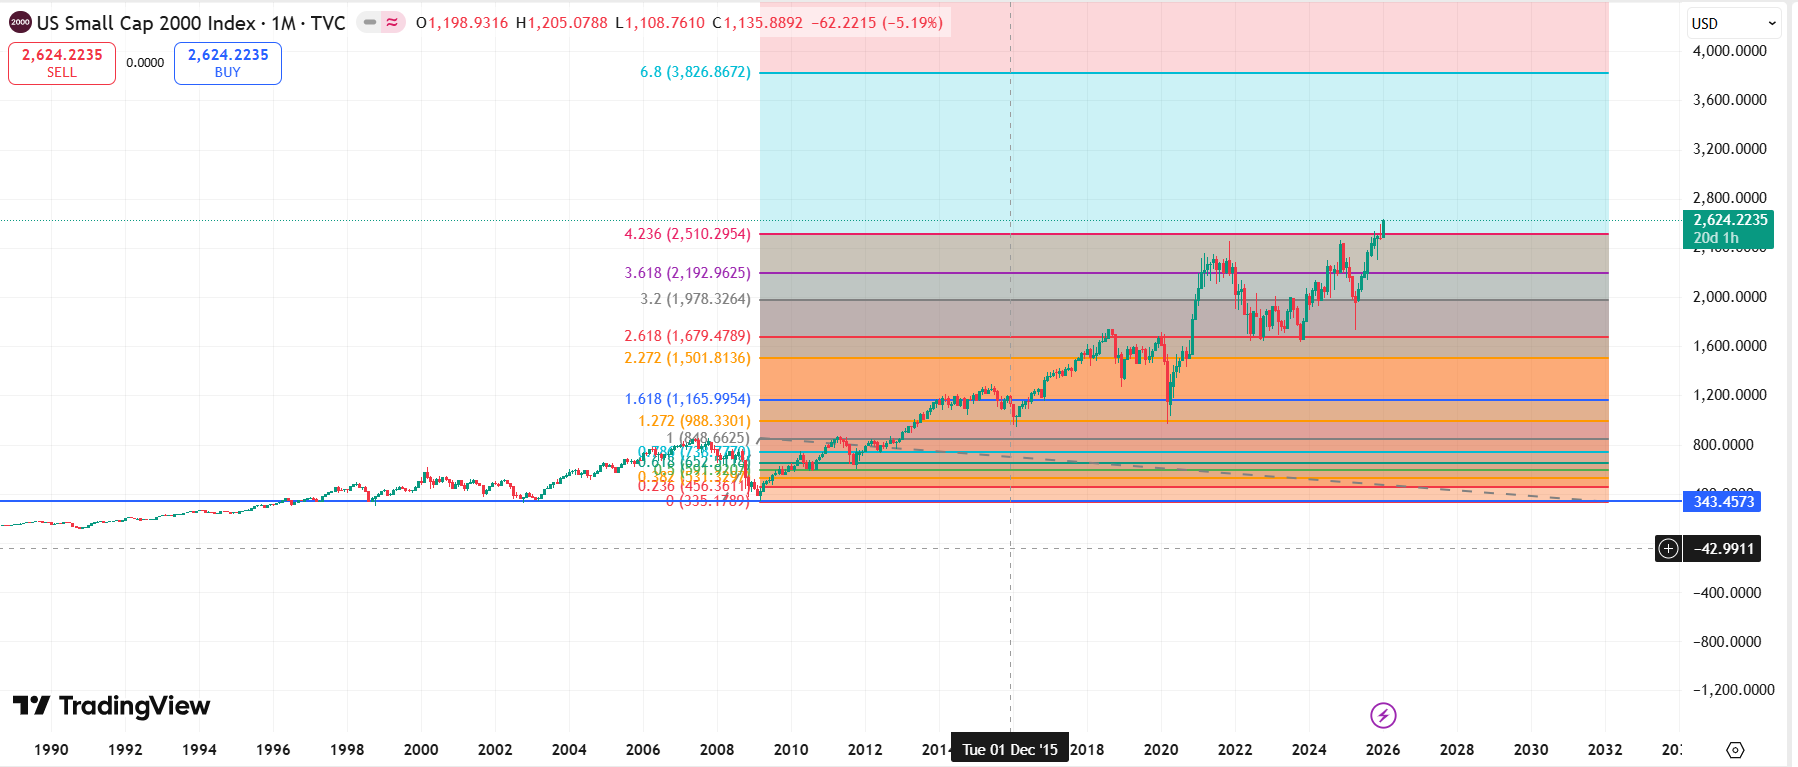
The Russell 2000 provides independent confirmation that the framework is not specific to large-cap stocks. From the March 2009 low of 343, using the 2007-2009 crash (856 → 343 = 513 points):
| Fibonacci Level | Target | Current Status |
|---|---|---|
| 1.618 | 1,173 | ✓ Exceeded 2014 |
| 2.618 | 1,686 | ✓ Exceeded 2017 |
| 3.618 | 2,199 | ✓ Exceeded 2021 |
| 4.236 | 2,516 | ✓ Exceeded 2024 |
| 6.8 | 3,831 | 🎯 Target: +46% from current (2,624) |
4.2. Relative Performance vs. Large Caps
The Russell 2000 tells an interesting story:
- Currently at 2,624, which is 4.3% above the 4.236 extension (2,516)
- Unlike the S&P 500, which has reached the 6.8 extension, the Russell is still 46% below its 6.8 target
- This relative underperformance is typical at market cycle peaks—breadth narrows, mega-caps dominate, small-caps lag
Historically, when large-caps reach terminal extensions while small-caps lag, it signals exhaustion rather than strength. The Russell's position confirms we are in late-cycle dynamics.
5. Cross-Index Summary
Dow Jones (DJI)
S&P 500 (SPX)
Russell 2000 (RUT)
5.1. Aggregate Performance Metrics
| Metric | DJI | SPX | RUT | Aggregate |
|---|---|---|---|---|
| Completed reactions scored | 10 | 5 | n/a | 15 |
| Median absolute error | 5.9% | 3.9% | n/a | — |
| Hit Rate (±5%) | 40% | 60% | n/a | 47% |
| Hit Rate (±10%) | 60% | 80% | n/a | 67% |
| Current vs. 6.8 Target | -15.7% | +1.6% | -31.5% | -15.2% |
Key Findings:
- S&P 500 lands closest: 3.9% median error, 4 of 5 completed reactions within ±10%. The DJI is looser (5.9% median, 6 of 10 within ±10%).
- All Indices Above 4.236: Every major U.S. index has exceeded the terminal extension threshold.
- S&P 500 near the 6.8 target: Currently within 1.6% of the 6.8 level—the highest rung in the framework.
- Same order across indices: Despite different constituents, all three indices climbed the rungs in the same sequence—the structural point—even where individual levels were overshot or undershot.
How much of this beats chance? The honest answer is: the sequence is the signal, the hit rate is not. A ladder of 8-11 rungs each with a ±10% band already covers roughly 60% of the plausible range, so a 60-80% "hit rate" barely clears what a random walk would produce — DJI's ±10% rate (60%) is essentially at that coverage null (lift ≈1.0, not significant), and the S&P's is only weakly above it (lift ≈1.4 on n=5, not significant). This in-sample compliance tally is not the evidence the framework rests on. The causal, out-of-sample, cross-market evidence is the durable-fib state machine in the Fibonacci Crash Study (§7.4). Full recompute: experiments/modern_era_compliance.py.
6. Current Position: Terminal Extension Zone
⚠️ Escape Velocity Alert
As of January 2026, U.S. equity markets have entered "Escape Velocity" — the terminal zone approaching and around the 6.8 extension. This is the zone in which prior major tops formed, and the record shows the path through it drifting wider each time (full treatment in 3.2 and 4.3):
- 1929: The clean single-leg top — reversed in the 6.8 zone with no overshoot → 89% crash by 1932.
- 1987: Overshot 6.8 by one parabolic leg, then a sharp ~34% collapse — a fast stop-hunt of the prior "safe" top rather than a cycle-ending bear.
- 2000: Blew off above 6.8 in a twin-spike instead of reversing cleanly at it — the trappiest top in the record → ~38% dot-com decline by 2002. (Path detail — the drift toward 11.8 and the later 4.23 retest — in 3.2/4.3.)
- 2026: The S&P 500 has just tagged its own 6.8 (6,966 vs 6,854, +1.6%) — the first of the three major indices to arrive. The Dow (~53% of the way from 4.23 to 6.8) and Russell (still near 4.23) have not.
This is not a prediction of imminent collapse. Markets can remain near these extensions for months or years (the 1928–29 blow-off spent ~15 months in its terminal zone before resolving), and only one of the three indices has even reached its 6.8. The structural point stands without being a timer: we are at the opening of the zone that has framed major tops — and, per the record above, the clean version rarely repeats. (Note: the 2007–2009 crash is not a 6.8 top; it is the anchor swing this modern ladder is measured from — see Section 1.)
6.1. What "Terminal Zone" Means
The 6.8 extension is the key binary inflection point in this framework. When price reaches the 6.8 level, there are two structural outcomes: reversal/pullback, or a break higher into bubble extension territory. Based on the historical record, the more common outcome is reversal or significant pullback — but the critical observation is that breaks above 6.8 are found almost exclusively inside bubble move structures. The 6.8 does not mean collapse is guaranteed; it means the market is at a level where the structural outcome tends to be binary and significant in either direction.
What the framework observes:
- Binary inflection: The 6.8 level separates normal bull market extensions from bubble territory. Breaks above 6.8 are structurally rare and, where they appear, tend to be associated with eventual larger declines — but this is a pattern in the data, not a law.
- Asymmetric risk profile: At the 6.8 level, upside is structurally limited while downside to prior extension levels (4.23, 3.20, 2.61) is substantial. This creates an asymmetric risk/reward profile for long positions.
- Behavioral context: Terminal extension zones tend to exhibit narrative concentration (broad consensus on bullish thesis), sentiment extremes, and breadth divergence. These are observable, not predictive.
The framework does not assert that every instance of reaching 6.8 produces a 40%+ decline. It asserts that the 6.8 level is a historically significant structural zone where prior cycle resolution has tended to be meaningful. The data is in the Fibonacci Crash Study.
6.2. Current Market Characteristics (January 2026)
📍 Structural Position Assessment
Geometric Status:
- S&P 500: At 6.8 extension (+1.6% above target)
- Dow Jones: 53% of distance from 4.236 to 6.8
- Russell 2000: Just above 4.236, lagging large-caps by 31%
Observable Conditions:
- Valuations: Shiller P/E at 35 (vs. 16 historical median)
- Breadth: Magnificent 7 stocks account for 60%+ of S&P 500 gains since 2023
- Sentiment: AAII Bull/Bear spread at +40% (extreme optimism)
- Positioning: Equity allocations at 15-year highs, cash at 15-year lows
- Volatility: VIX averaging 12-15 (25th percentile historically)
- Leverage: Margin debt near record highs relative to GDP
Framework Compliance:
- Price has repeatedly reacted near Fibonacci levels over 17 years (with several 10-20% misses)
- Current position is broadly comparable to the 1928-1929 and 1999-2000 terminal-zone setups
- Behavioral signatures resemble those seen in prior terminal extension zones
- The position shows up across all three indices, so it is structural rather than index-specific
6.3. What the Framework Does NOT Tell Us
It's critical to understand the limits of structural analysis:
- Not a Timer: The framework identifies structural position, not timing. The market can remain at terminal extensions for months or years.
- Not a Trigger: The framework does not predict what will cause a reversal (Fed policy, geopolitical shock, liquidity crisis, etc.). It only identifies that we are at levels where reversals have historically occurred.
- Not Deterministic: Markets can exceed any level. The 6.8 extension is a probabilistic boundary, not a physical wall. Overshoots of 3-8% are common.
- Not Linear: The path from current levels to eventual retracement targets will not be a straight line. Expect rallies, failed breakdowns, and whipsaw volatility.
What the framework DOES tell us: We are in the same structural position that has preceded every major market peak in the last 130 years. The Fibonacci extension levels observed in prior cycles have continued to produce reactions in the modern era. The terminal extension zone (4.236-6.8) has historically been associated with significant cycle resolution. We do not have a closed loop on whether the current instance will resolve consistent with prior patterns — that is what the framework is designed to monitor.
This is observation, not prediction. We document what happened. We document where we are now. Whether the current cycle matches prior structural patterns is the open question.
Conclusion: Modern Era — What the Ladder Shows
Across three major U.S. equity indices, spanning 17 years, covering the longest bull market in history, a pandemic, multiple corrections, and the AI revolution, the levels projected from the 2009 anchor have repeatedly lined up with points where the market paused, turned, or consolidated — not at every level, and not to the point, but often enough to be worth documenting.
The Numbers (recomputed honestly from the reaction tables):
- 15 completed level reactions scored across DJI and SPX (2009-2026); the Russell shows only "exceeded" flags, with no reaction prices to score
- DJI median absolute error 5.9%; SPX 3.9%
- Aggregate hit rate 47% within ±5%, 67% within ±10%
- Against a coverage-aware null this is at or barely above chance — the ladder's order is what holds up, not a precise hit rate
- S&P 500 currently within 1.6% of its 6.8 extension target
The Current Situation:
As of January 2026, the S&P 500 is trading at 6,966—within 1.6% of the 6.8 extension target calculated from the March 2009 low. This is a structural position comparable to September 1929, March 2000, and October 2007, each of which was followed by a 40-89% decline within 24 months. The important caveat: those are the instances people remember because they resolved that way. Reaching the terminal zone raises the structural risk; it does not make a decline of that size inevitable or set its timing, and markets have held near these levels for extended periods before.
The Framework's Message:
Markets exhibit structural patterns that appear consistently across different eras. News, earnings, and policy shape the narrative — but the Fibonacci extension levels have consistently appeared as inflection zones regardless of the fundamental context. The technology has changed. The participants have changed. The information infrastructure has changed. But the structural levels continue to act as observable reference points.
Telegraph wires governed the same geometric progression as fiber optic networks. Specialist pits followed the same Fibonacci ratios as algorithmic dark pools. Human panic in 1929 traced the same extension levels as machine-driven liquidation in 2020.
You are here: At the terminal extension of a 17-year super-cycle, in the same structural position that has marked every major market peak since 1896. The framework has identified this position with considerable consistency. What happens next will reveal whether the historical pattern holds once more.
The structure is documented. The compliance is observable. Now we observe what follows.