Architect 2.1: DJI Inception Swing Timeline and Extension Ladder
Two-anchor structural study of the DJI 1896–1929: expansion series, inception swing, and the 4.236/6.80 Ladder model derivation
Method: The full inception rally anchor (20.80–74.76) is tested against the 1.272 / 1.618 / 2.20 / 2.618 / 3.60 / 4.236 / 6.80 extension ladder, tracking the 1896–1929 super-cycle through to the Great Depression collapse. These are the earliest available DJI structural records and form the empirical foundation for the 4.236/6.80 Ladder Trading Model defined at the end of this post.
DJI Inception Rally and Expansion 1896–1929
- Symbol:
- Dow Jones Industrial Average (DJI), Weekly
- Anchor Low:
- 20.80 (1896 low)
- Anchor High:
- 74.76 (January 1906 high)
- Range:
- 53.96 points — the full inception expansion as anchor
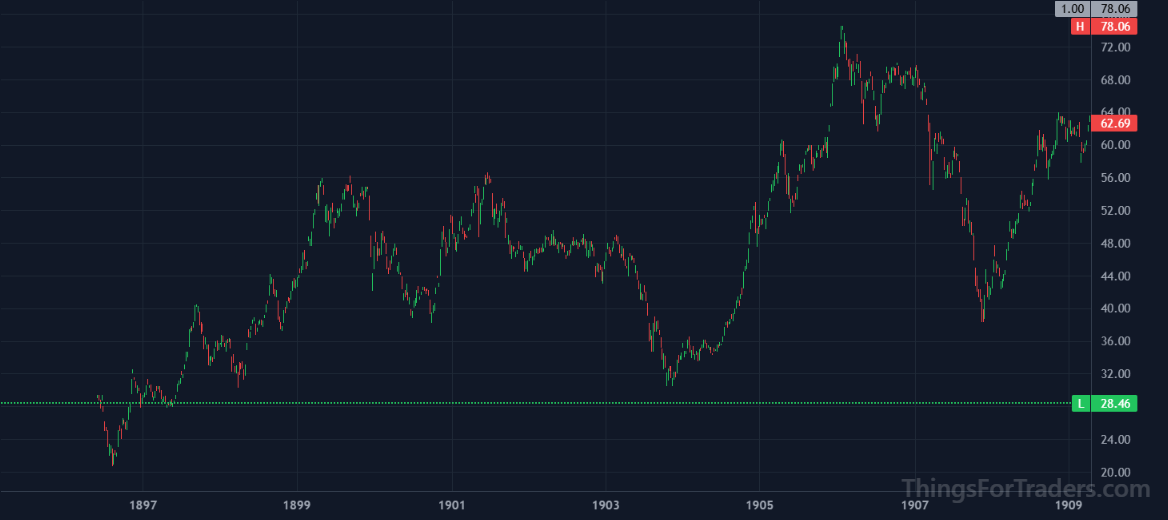
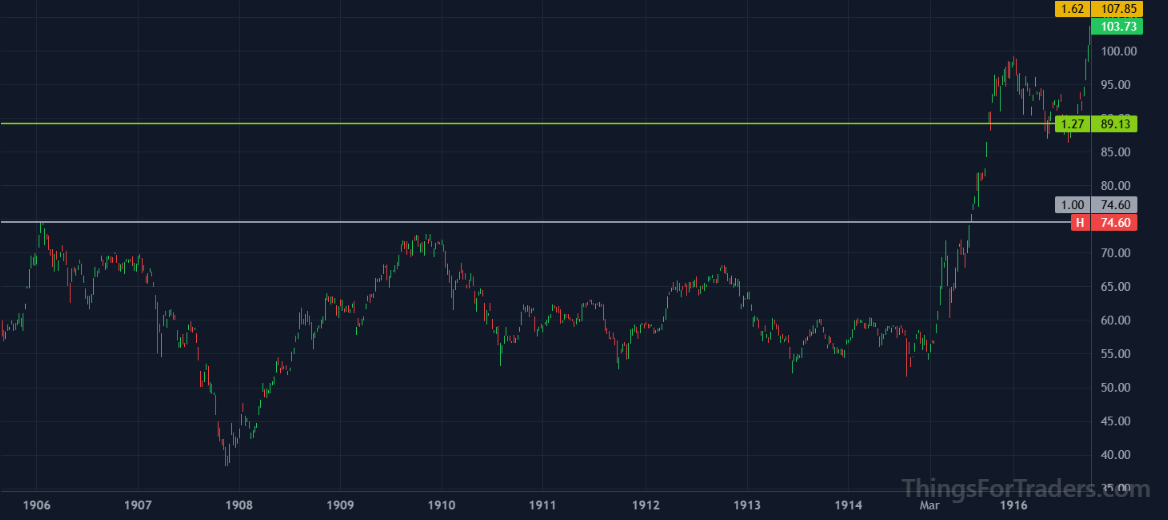
This expansion series uses the first major multi‑year advance in DJI history as its anchor swing: the low of 20.80 in 1896 and the high of 74.76 made in January 1906, the peak of the first great expansion before the 1907 Banker's Panic. (An earlier version of this page dated the anchor high to 1901; that was an error. The 1901 high was around 56.68, and the 74.76 print belongs to January 1906.) This is the same broad era whose charts Ralph Nelson Elliott later studied when developing Wave Theory, so — whether or not one subscribes to Elliott's framework — these are among the literal market structures he was analysing.
Elliott context: the market of this era displays the kind of multi‑drive advance and multi‑leg correction Elliott later formalised, and he built his theory roughly thirty years afterward using charts from around this period. The connection is worth noting because Elliott's work proposes a fractal structure in which one swing carries information about later swings, which is conceptually adjacent to what the Fibonacci extension model examines. It should not be read as more than an adjacency. The overlap does not make this an Elliott‑based thesis, and we make no specific wave‑count claim here; it is simply notable that the foundational swing in this framework sits in the same historical material that informed Elliott's original observations.
Phase 1: The Inception Anchor and Initial Extensions
Phase 2: Mid-Cycle Volatility and Structural Breaks (2.20–2.618)
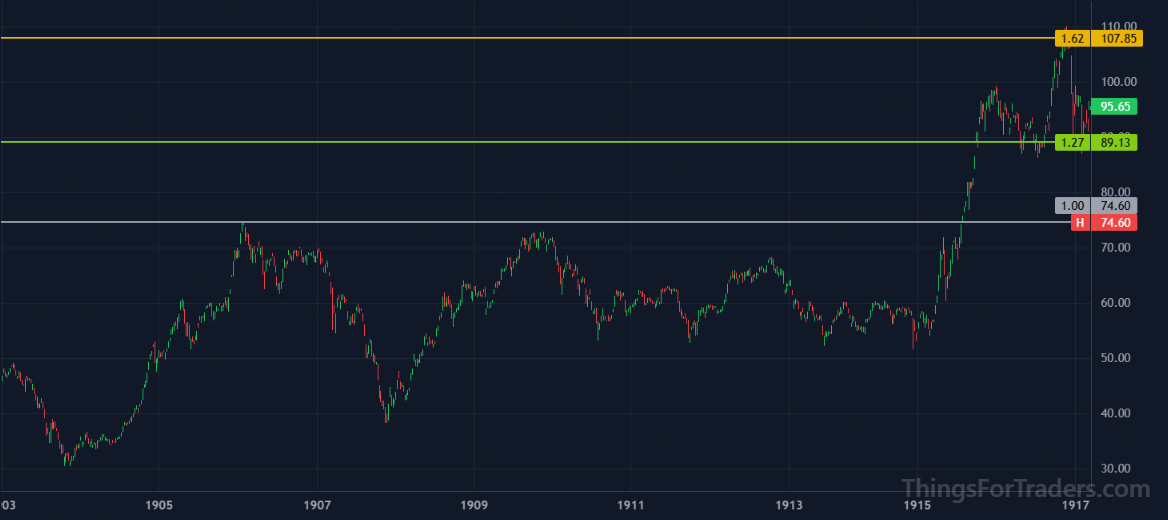
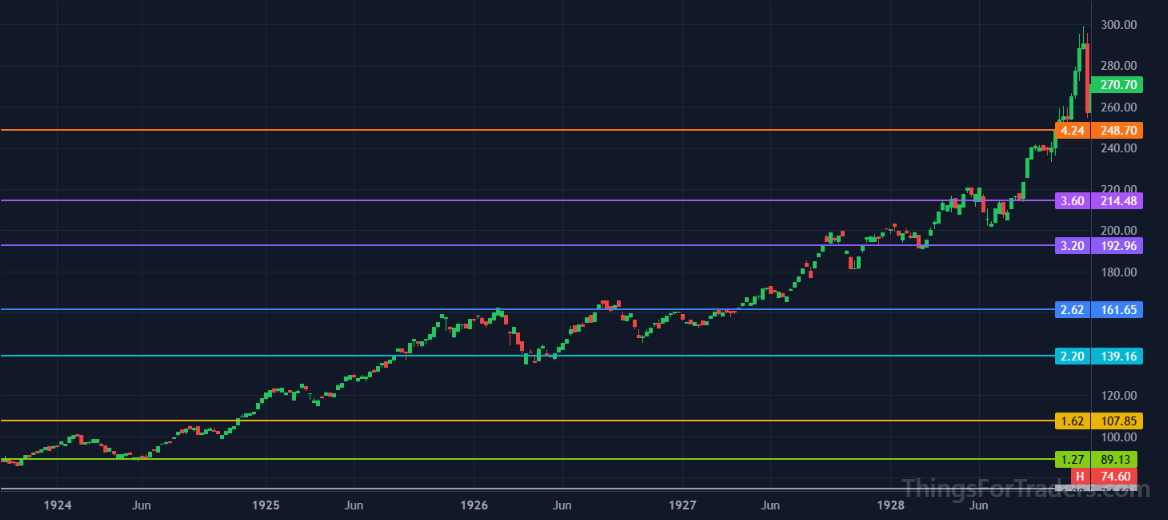
As the trend matured into the early 20th century, the expansion grid highlights a period of significant structural traps where price fluctuated between the 2.20 and 2.618 levels for an extended period.
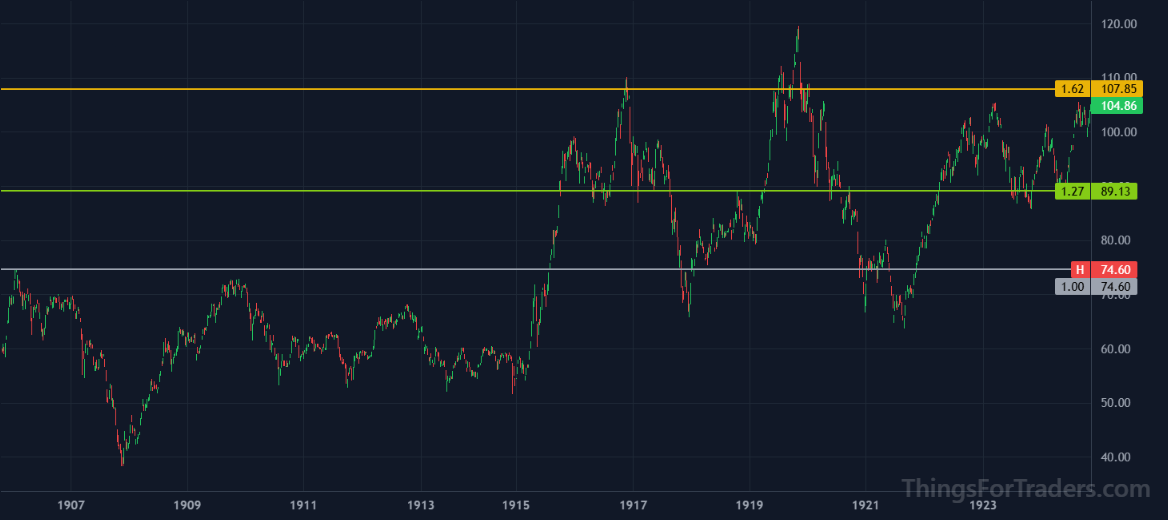
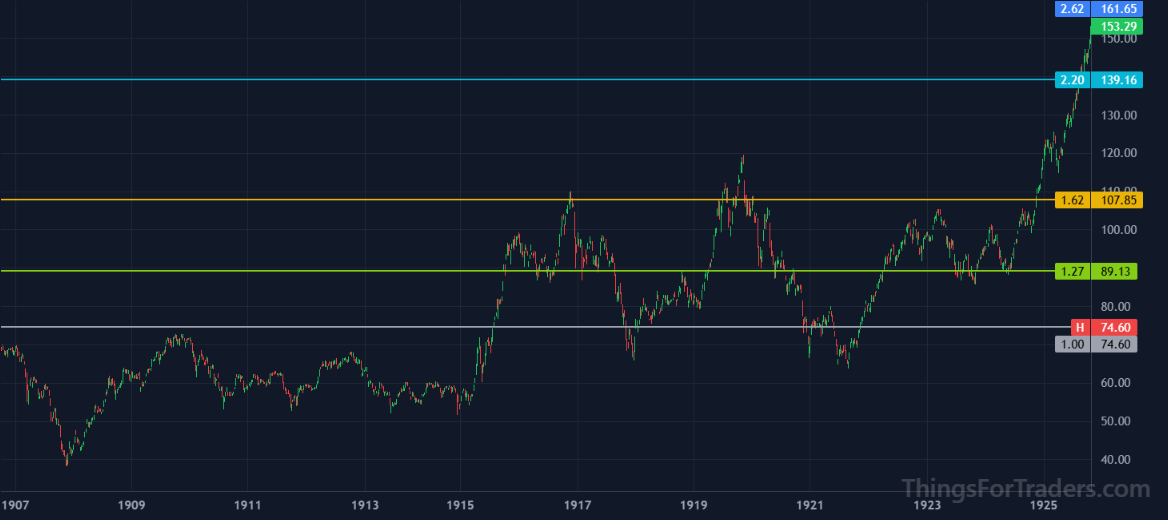
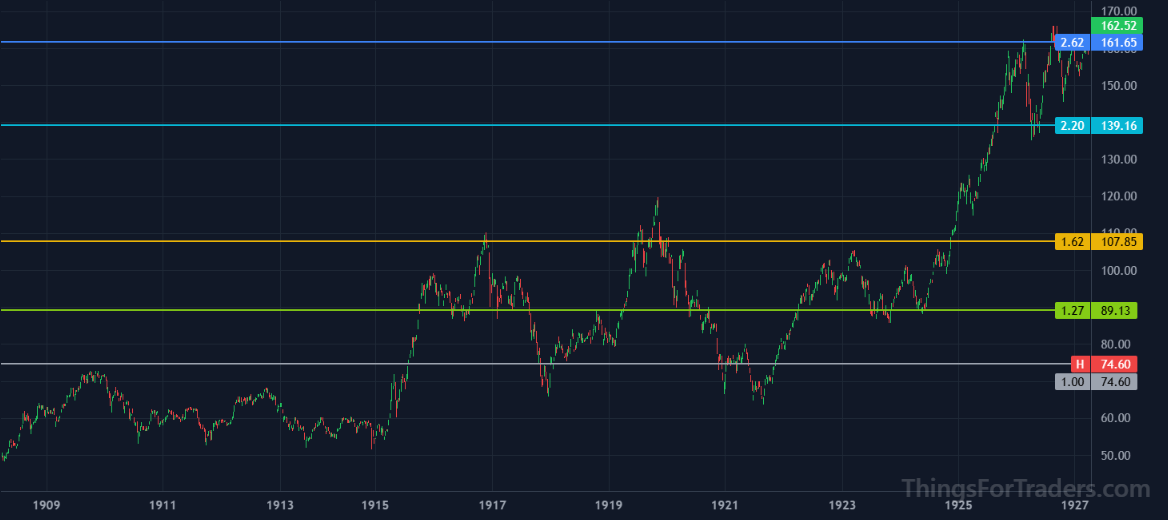
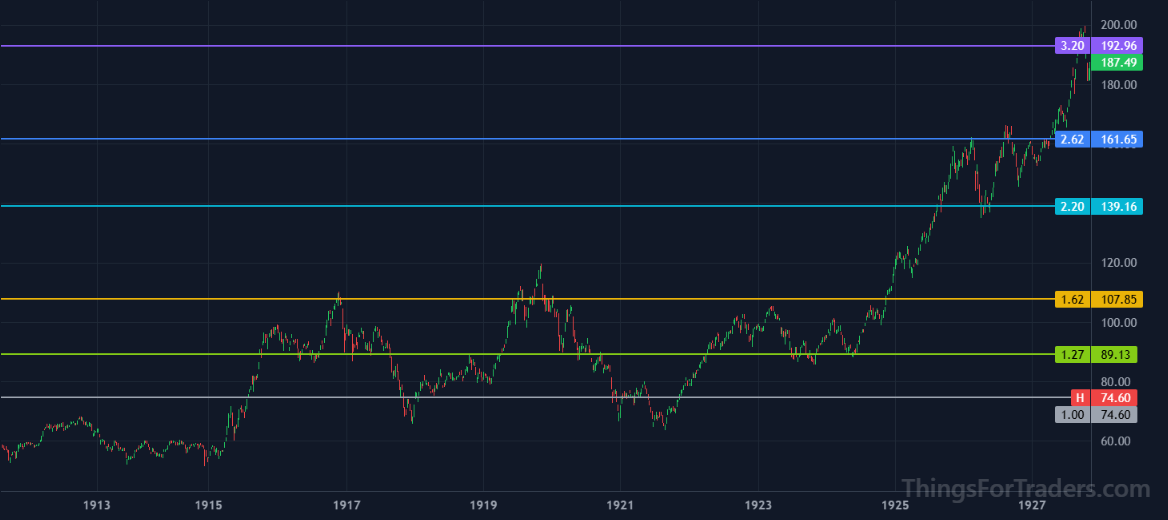
- May 1924: 1.272 holds on critical retest — the first successful hold after a 14-year range. Continuation regime confirmed.
- February 1926: 2.618 hit (162.3 against a projected 162.1).
- March 1926: correction holds near 2.20 (low ~135, roughly 3% below the level, then recovers).
- 2.618 decisive break: over-performance phase begins — the Roaring Twenties.
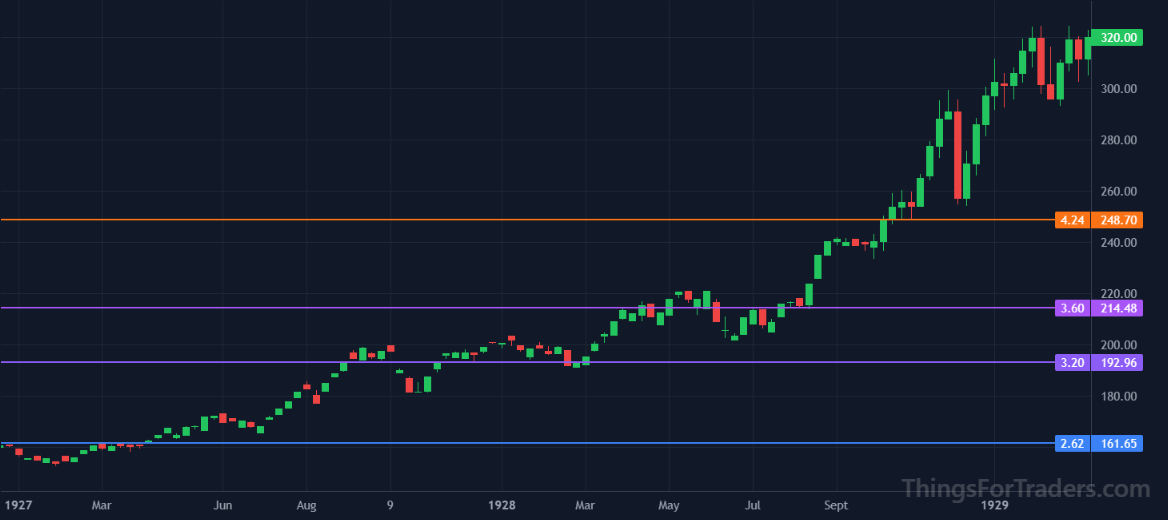
Phase 3: The Parabolic Phase and the 4.236 Trap (1928)
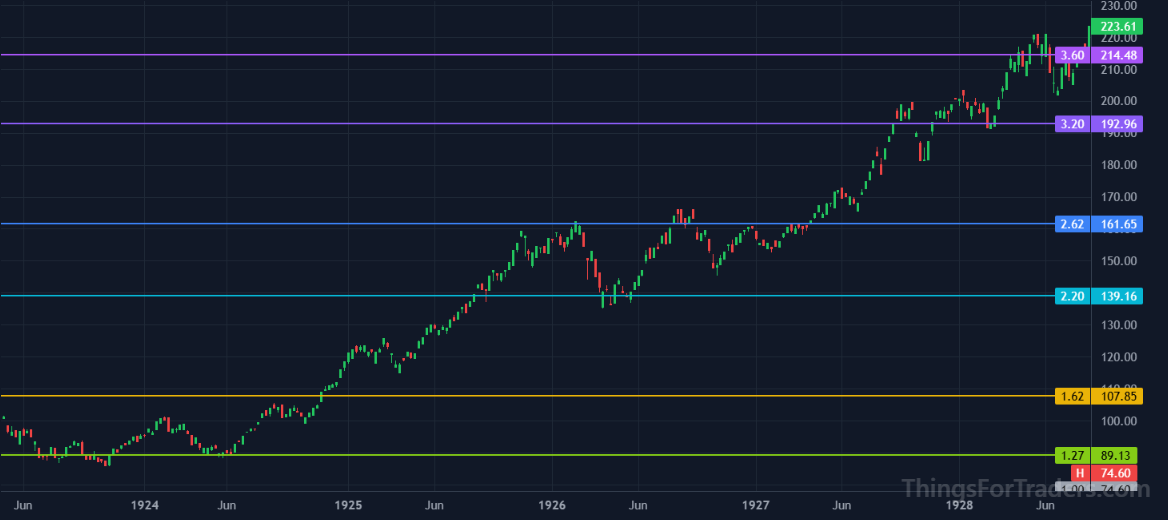
In late 1928, the DJI reached the 4.236 extension. This level has often coincided with the end of an expansion, but the extreme momentum of the era produced a false reversal signal instead — the first documented instance of what this study calls the Recovery Exception.
Phase 4: The 1929 Cycle High and Great Depression Collapse
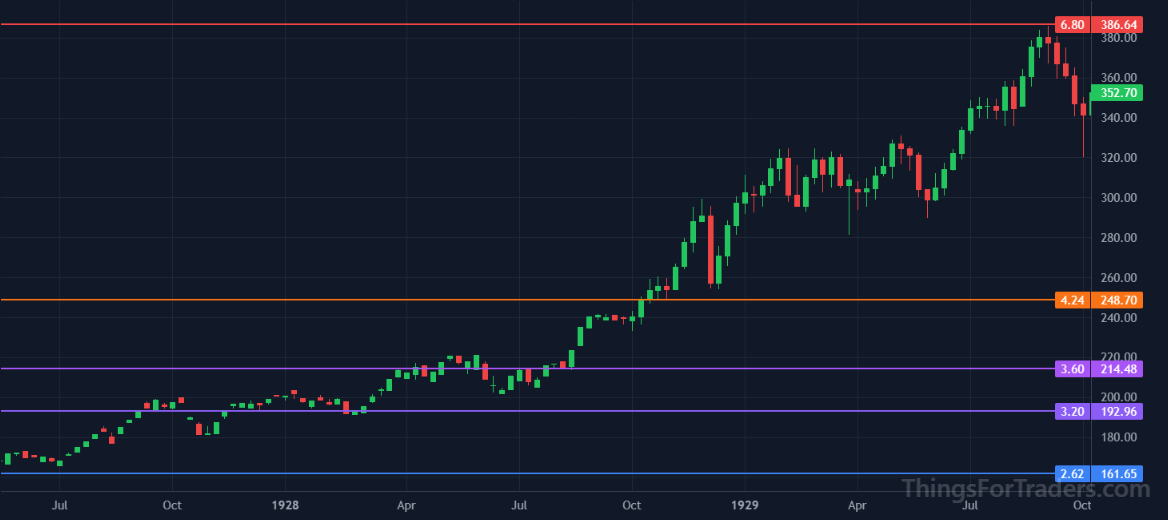
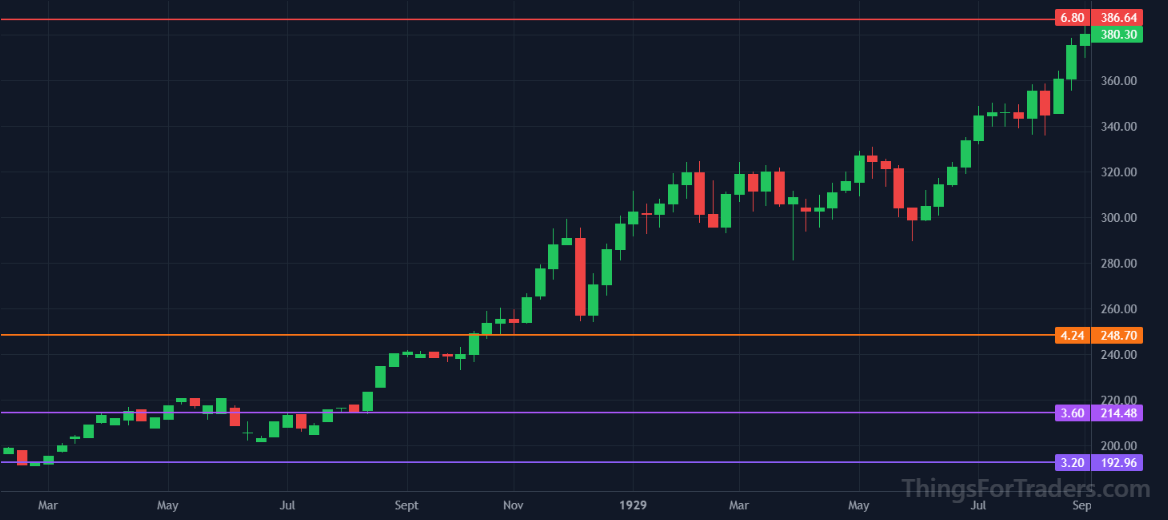
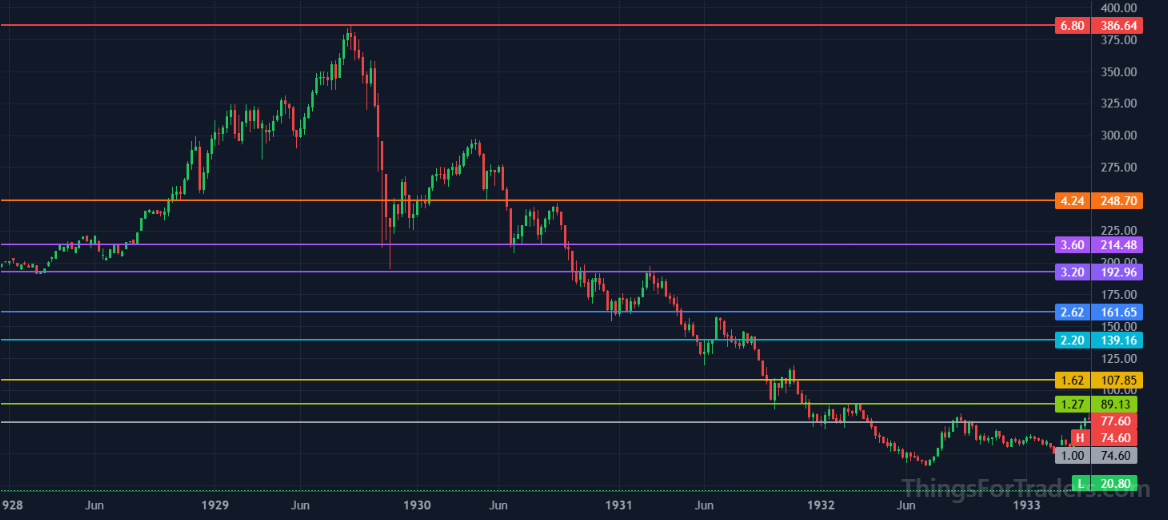
Following the 4.236 recovery exception, the DJI continued higher into the 6.80 extension — the next level in the expansion sequence from the 1896–1906 anchor swing. The subsequent decline began soon after price reached this region. This is worth noting, but it does not imply a hard boundary; it marks the furthest extension reached in this particular cycle, and offers one data point on how far an extended move can travel before turning. Later cycles in this series show the 6.80 region can be exceeded.
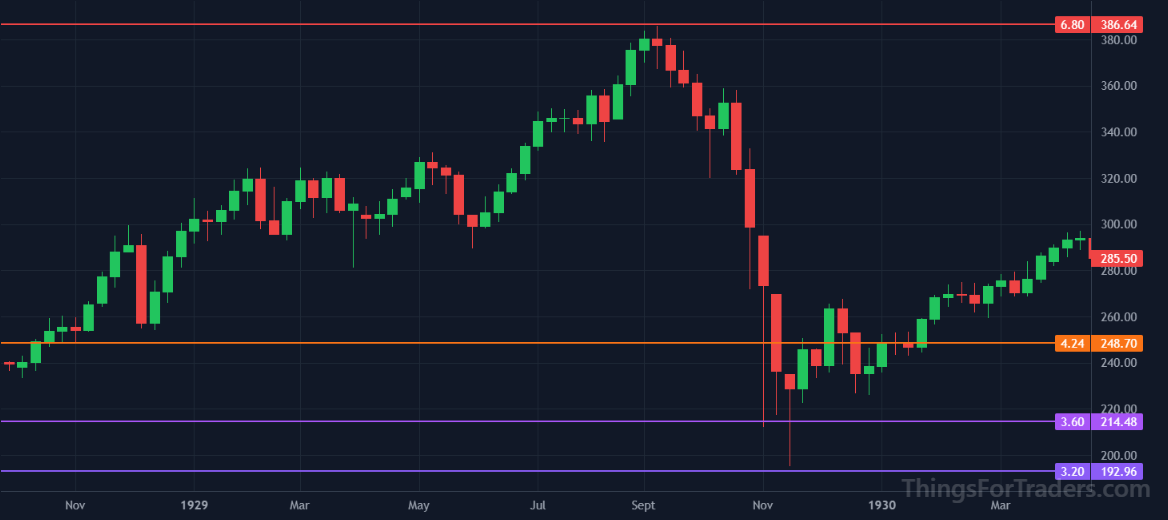
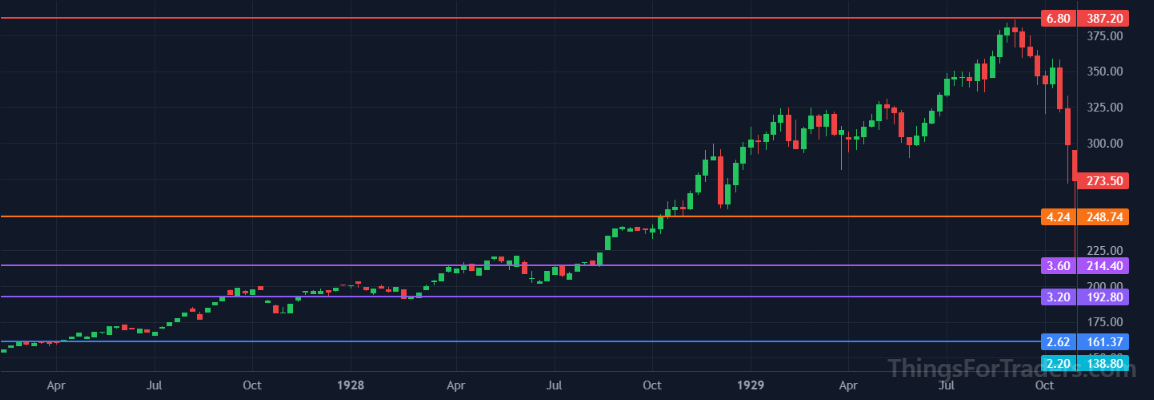
- October 1928: 4.236 hit and rejected. Recovery within 3 candles triggers the Recovery Exception.
- September 1929: 6.80 region reached — the cycle high (386.1, within ~0.4% of the projected 387.7).
- October–November 1929: crash wicks to 3.60; closes consolidate near 4.236.
- 4.236 and 3.60 break: secular bear trend begins — no structural support until the next expansion grid anchor.
The "4.236 / 6.80 Ladder" Trading Model
Based on observations from the 1896–1929 expansion series, the following model can be formalised. It assumes the initial impulse of a new market (the Anchor) contains the mathematical structure governing all subsequent expansion tiers. The level behaviour documented here recurs in every subsequent DJI cycle studied in this series.
I. The Anchor Principle
- Definition: A model is only as valid as its Anchor Swing. The Anchor must be a clear, impulsive recovery from a significant low (e.g., the 1896 inception low), forming a structurally meaningful high that defines the 1.0 level.
- Persistence: Once a valid Anchor is identified, it remains active for the entire expansion cycle. Anchors are not redrawn on every pullback or minor correction — a common mistake in many studies. A single Anchor can project the full extension sequence up to the 6.8 region.
- Activation: The Ladder becomes active only after price reclaims and closes above the 1.0 level (the Anchor High) on a weekly basis, confirming that the expansion phase is underway.
II. Pivot Level Norms (Support & Resistance)
- 1.618 (The First Exhaustion): The primary checkpoint for the trend. Expect a multi-month pause or sideways correction here. High-probability zone for first-leg profit-taking.
- 2.20–2.618 Zone (The Transition Zone): The most "trappy" area of the ladder. False breakouts and whipsaws are common. A level in this zone that acts as a multi-year ceiling will trigger a parabolic expansion once definitively cleared (Rule of Polarity). In a liquidity panic, the 2.20 and 1.618 levels are unreliable as floors — failure at 2.20 implies a return to the 1.0 Anchor High.
III. Upper-Extension Guidelines
- 3.60: A level that has occasionally acted as temporary support during sharp declines. Bounces from this region are common, but they have not historically altered the broader direction once a major unwind is underway.
- 4.236: One of the more frequent cycle-ending zones in the dataset. Several major expansions (including the early 1900s and late 1920s) turned in or around this region. A sharp rejection here has often coincided with the end of a mature trend, though it does not always, and the Recovery Exception below is one way it fails.
- 6.80: The furthest extension reached in the completed expansion cycles studied here. It is best read as the highest observed point in this dataset rather than a boundary price cannot pass — later cycles in this series reach it and, in some cases, exceed it. When price reaches this region the model treats it as the far end of the expansion ladder given the data to date.
IV. The “Recovery Exception” — Reaction vs. Reversal
- Concept: A rejection at 4.236 is often a candidate for a cycle high. However, not every reaction at this level develops into a full reversal. If the initial dip is shallow and quickly reabsorbed, the selling pressure that would typically drive a larger decline may already have been spent.
- Implication: When the market rejects 4.236 but immediately stabilises and reclaims the level without forming a meaningful corrective structure, the probability of a clean 4.236 break increases. In these cases, the model allows for continuation toward the next extension in the sequence.
- Historical instance: In late 1928, the Dow produced a brief reaction at 4.236 that failed to develop into a sustained reversal. The shallow pullback was quickly absorbed, and price continued into the 6.80 region the following year. This behaviour is rare but demonstrates how a failed reversal attempt can precede a strong extension.
V. Execution Guidelines for the Uptrend
- Entry: Long positions initiated upon weekly close above 1.0 (Anchor High) or successful retest of 1.272.
- Stop Loss: During an established uptrend, stops move up to the last cleared Fibonacci level (e.g., if price is at 4.236, the 2.618 becomes the structural floor).
- Profit Taking: Scale out 25% at 1.618; scale out 50% at 4.236; total exit at 6.80.
- Re-Entry: If the Recovery Exception (Rule IV) is triggered, re-enter at the 4.236 reclaim with a target of 6.80.
Level Efficacy Summary
| Level | Market Utility | Reliability |
|---|---|---|
| 1.272 | Trend Confirmation | Reliable — retest frequently occurs |
| 1.618 | Local Reaction Zone | Reliable |
| 2.20 | Mid-Trend Support | Weak — trappy, fails in panics |
| 2.618 | Structural Ceiling | Reliable — the primary breakout level |
| 4.236 | Common Cycle Peak | Reliable — subject to Recovery Exception |
| 6.80 | Furthest Extension | Highest level reached in the dataset; can be exceeded |
Pattern Summary
Across the 33-year inception super-cycle 1896–1929, the same structural checkpoints line up with the major turning points. 1.272 is the first reaction pivot. 1.618 is the continuation gate. 2.20–2.618 is the decision zone where multi-year ceilings form before parabolic breakouts. 4.236 is a common cycle-ending zone — subject to the Recovery Exception in parabolic regimes. 6.80 is the furthest extension reached in this cycle; it is not a hard ceiling, and later cycles in this series show it can be exceeded.
Key takeaway: the earliest available DJI data already expresses the full operating framework of the 4.236/6.80 Ladder across two independent anchor definitions. This convergence across different anchor sizes — using the same mathematical proportions — is the foundation of all subsequent anchor tests covered in this series. Post 2.2 begins where this post ends: the Great Depression collapse becomes the next expansion anchor.