Architect 2.2: Great Depression Anchor and Rolling Anchor Tests
DJI rolling-anchor Fibonacci study: 1932 through the modern era
Method: Each major market correction is used as a fresh Fibonacci anchor. The same 1.272 / 1.618 / 2.20 / 2.618 / 3.60 / 4.236 / 6.80 extension ladder is then tested against the subsequent cycle. When a cycle reaches the 6.80 region or beyond and then rolls over, or produces a confirmed 4.236 retest, that swing becomes the primary input for the next anchor. This produces a rolling, repeatable cross-era test of the framework across different compositions, regulatory regimes, and volatility conditions.
Context note: the previous post established the DJI inception swing from 1896. This post continues from where that sequence concluded — the 1929–1933 Depression — and tracks each subsequent major cyclic anchor through to current structure. By the time this series reaches post-2000 anchors, the moves described had generally-accepted news catalysts and were widely considered unpredictable in real-time. The data is presented without narrative adjustment.
Anchor 1: Great Depression Expansion Cycle (1932–1987)
- Symbol:
- Dow Jones Industrial Average (DJI), Weekly
- Anchor High:
- 385.00 (1929 Peak)
- Anchor Low:
- 42.92 (July 1932)
- Range:
- 342.08 points — extension levels derived from this swing
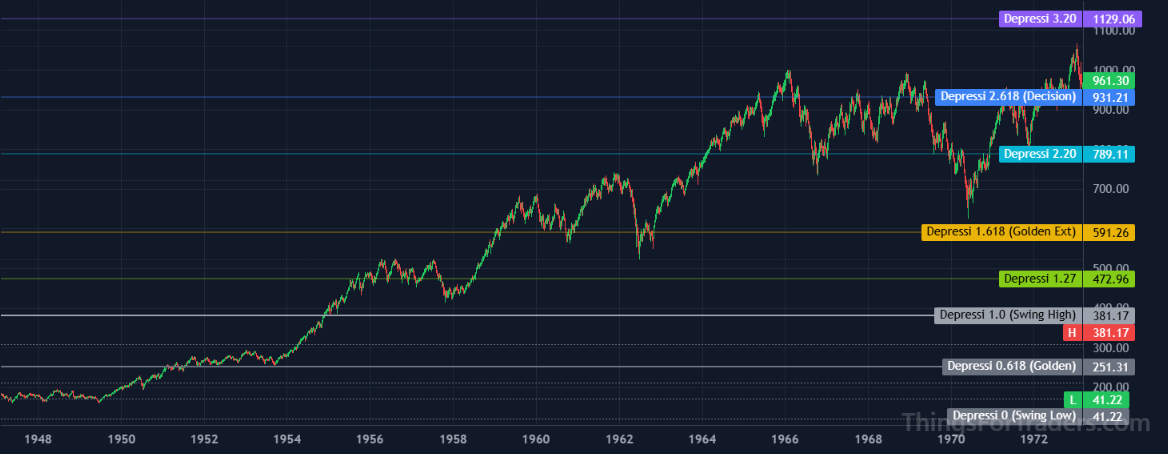
Following the 1932 low, the DJI began a multi-decade recovery phase. The Fibonacci extension ladder derived from the 1929 high and 1932 low governed structurally significant price interactions for the following 55 years.
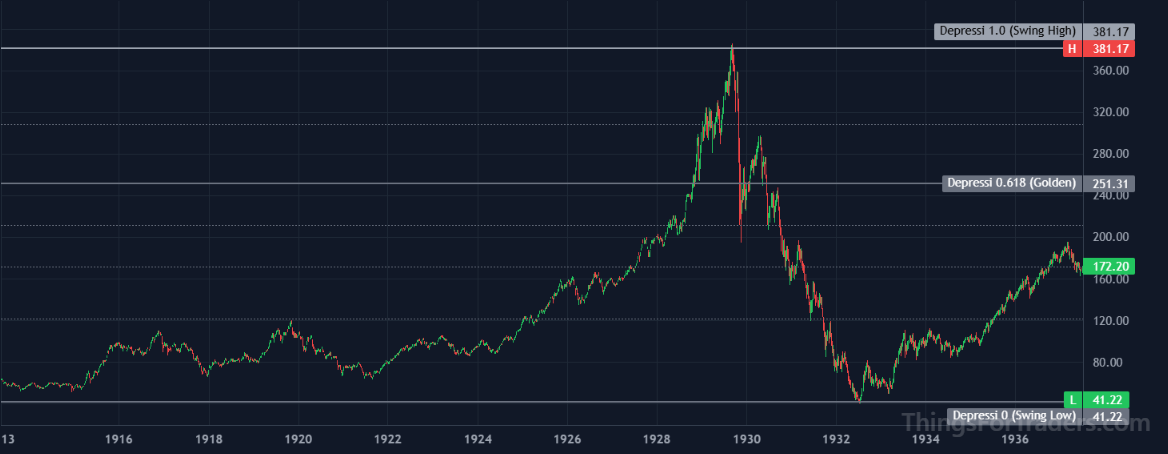
Phase 1: Initial Expansion and the 1.272 Reaction (1955)
The post-war recovery produced a largely uninterrupted rally from the 1932 low. The first structurally meaningful interaction with the extension grid occurred at the 1.272 level.
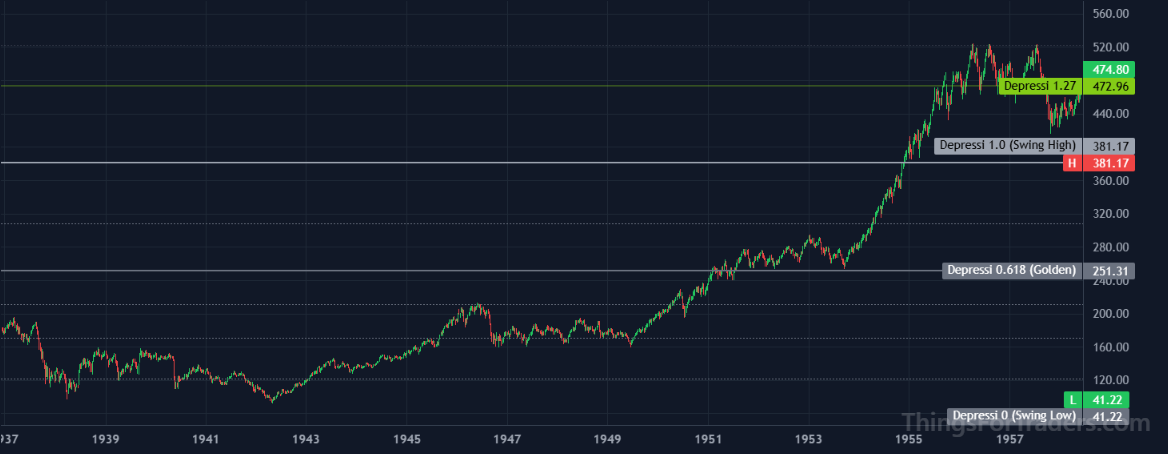
- September 1955: 1.272 extension (approx. 477) tagged. First notable weekly reaction occurs here after an uninterrupted post-war advance.
Phase 2: The 1.618 Stall and Multi-Year Consolidation (1959–1963)
The 1.618 extension acted as a structural ceiling across a four-year period, transitioning the market from a straightforward recovery phase into a structured range.
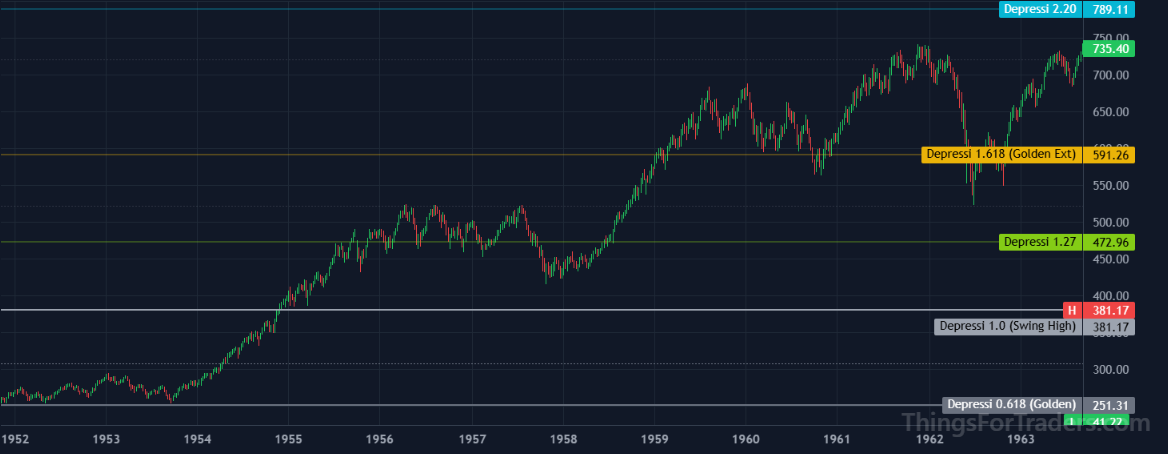
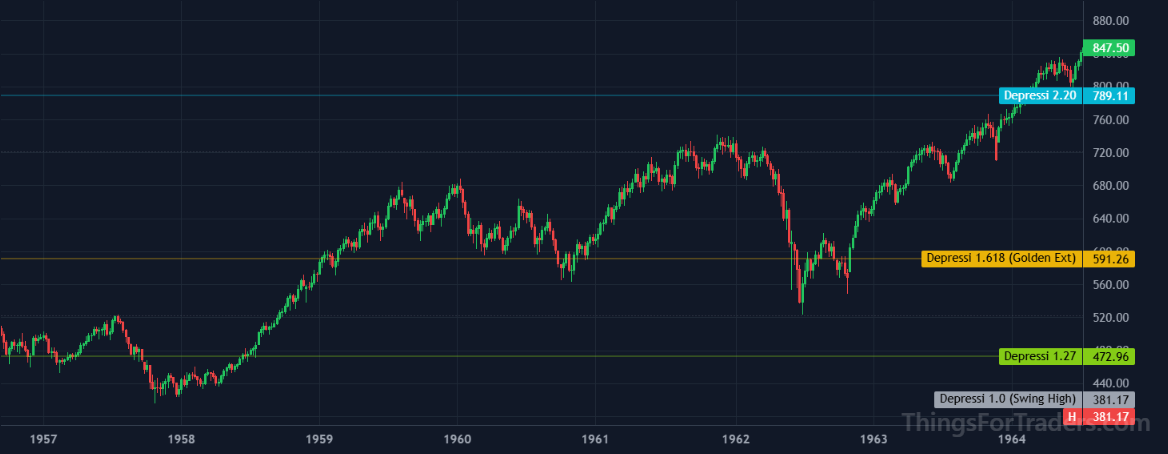
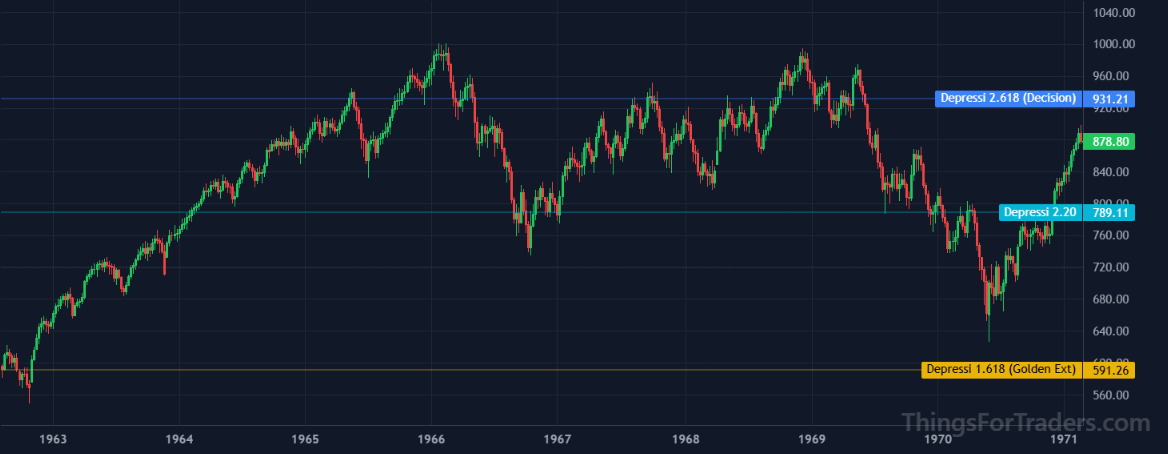
- April 1959: 1.618 extension (approx. 596) reached. Pronounced stall begins.
- 1959–1963: Multi-year oscillation around the 1.618 level.
- October 1963: 1.618 decisively broken on weekly basis. Rally toward the 2.618 begins.
Phase 3: The 17-Year Range — 2.20 to 2.618 (1965–1982)
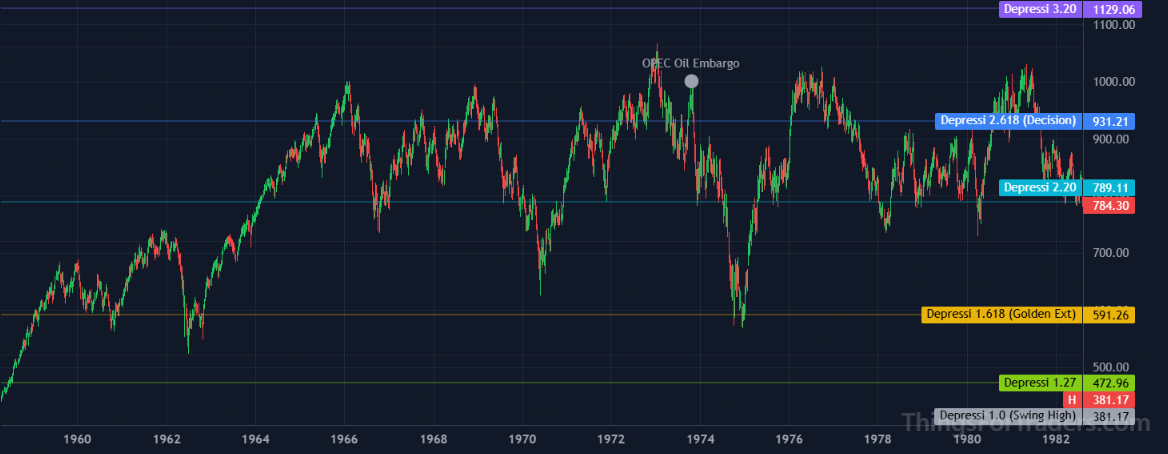
This period represents the most structurally defined phase of the Great Depression anchor. For approximately 17 years, the DJI remained contained within the 2.20 and 2.618 extension levels, with the ceiling failing repeatedly before a decisive break.
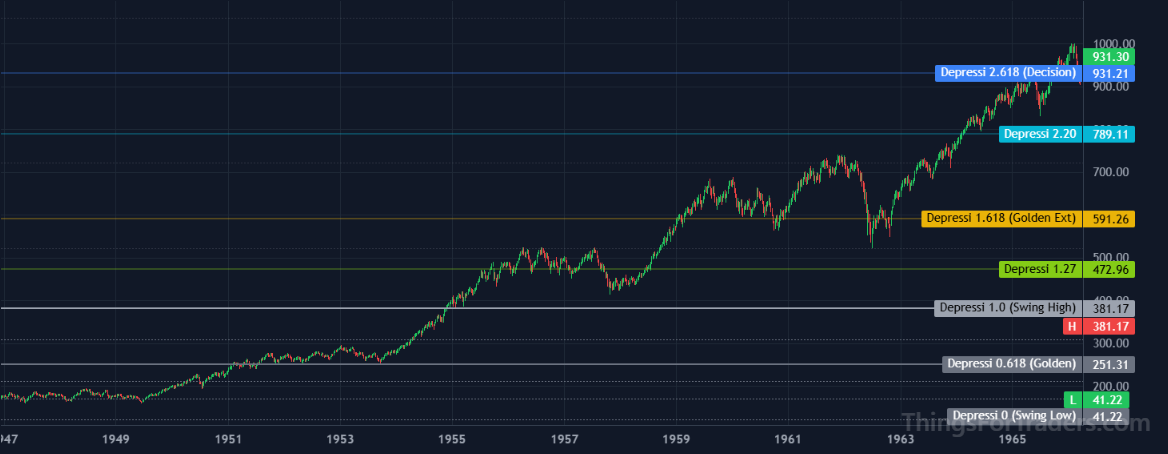
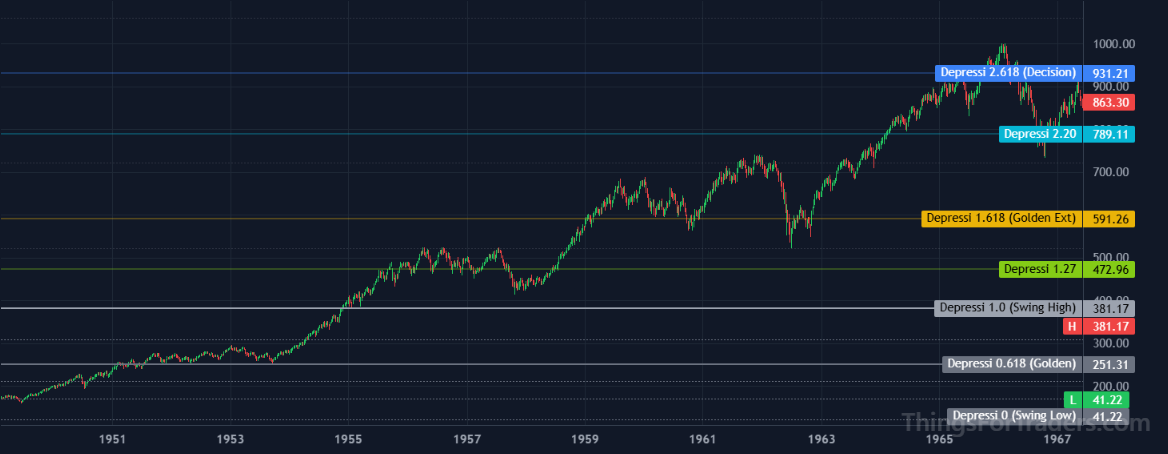
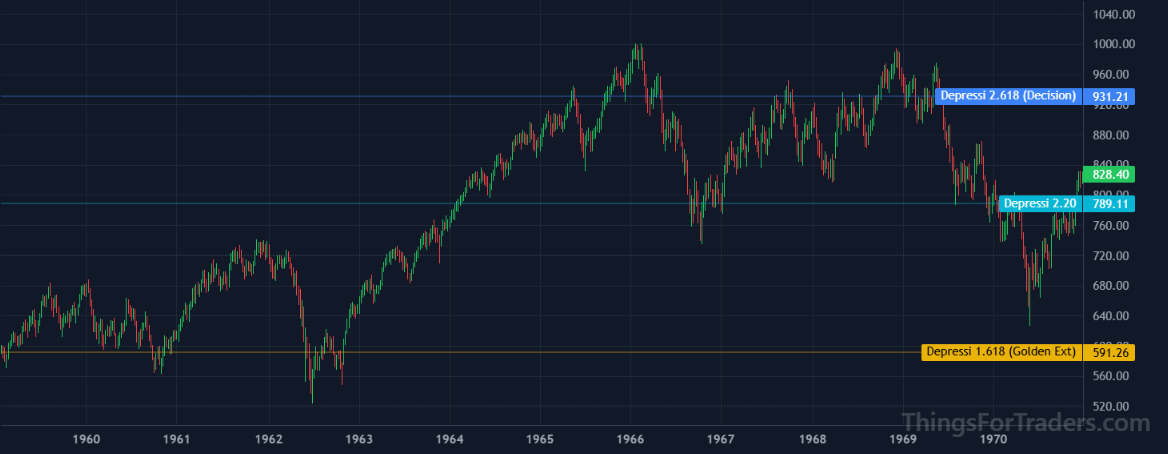
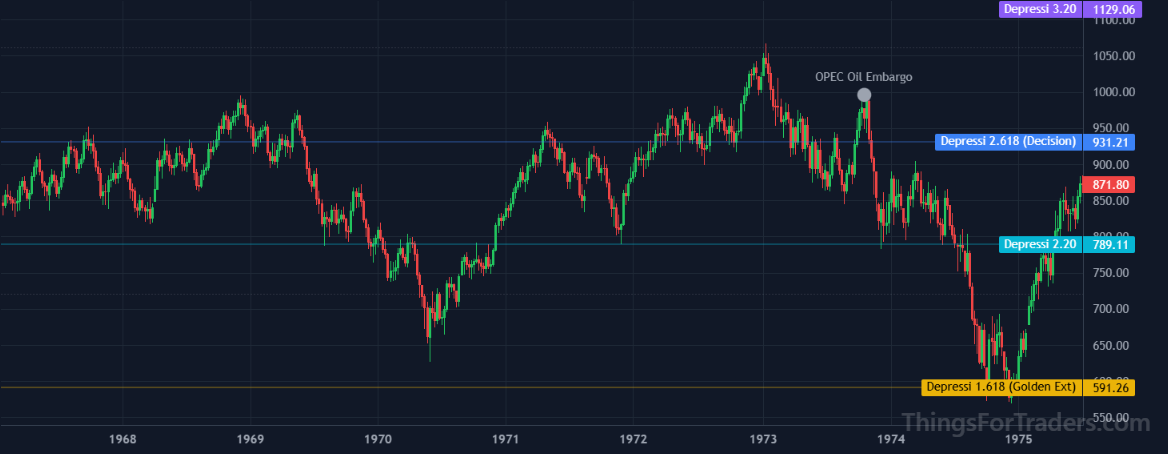
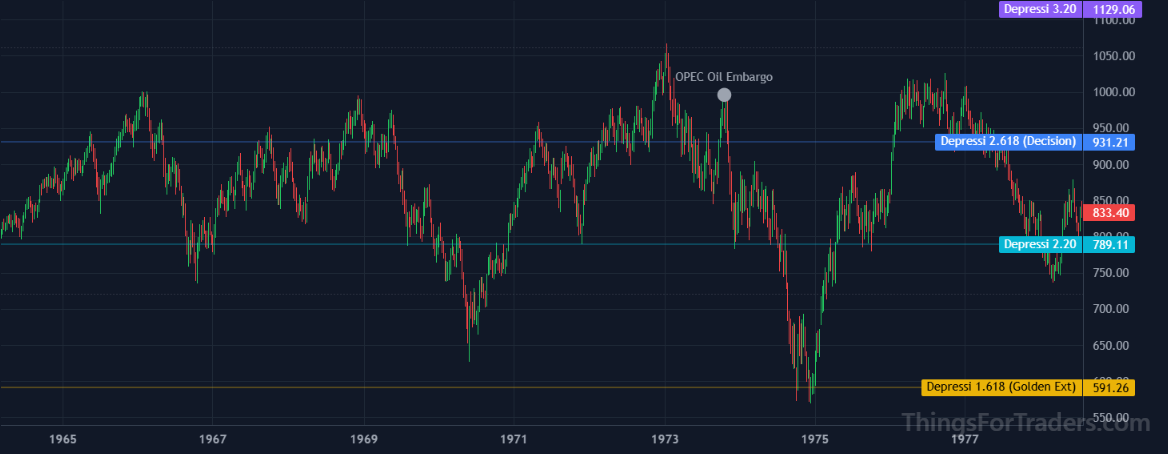
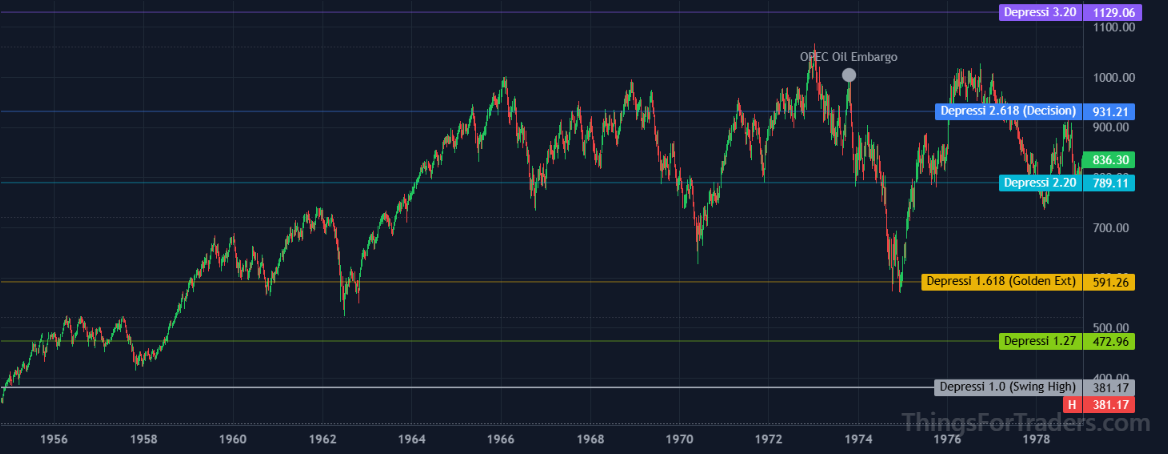
- November 1965: 2.618 extension (approx. 938) hit for the first time.
- September 1966: Sharp correction to a low close to the 2.20 expansion (approx. 795).
- October 1968: Retest of the 2.618 ceiling; breakout fails to hold.
- June 1970: Liquidity crash finds support at the 1.618 level (approx. 596).
- September 1972: 2.618 ceiling tagged again with brief overshoot; 40% decline follows.
- November 1974: Crash low terminates at the 1.618 level — generational low.
- 1976–1982: Range oscillation resumes between 2.20 and 2.618.
- May 1982: Final range low holds on the 2.20 level.
From November 1965 through May 1982 the DJI spent approximately 17 years in a range almost entirely bounded by the 2.20 and 2.618 levels, with the 2.618 as a ceiling that repeatedly failed and the 2.20 as the recurrent structural low. Two crash events during this period reached the 1.618 level rather than the 2.20. The final range low in May 1982 held precisely on the 2.20. This mirrors the 14-year 0.76–1.61 range observed in the original inception swing cycle, one structural tier higher.
Phase 4: Parabolic Expansion Through the 6.80 to the 1987 High (1982–1987)
The break of the 17-year 2.618 ceiling in October 1982 produced an immediate and sustained acceleration characteristic of over-performance phases identified across prior anchor cycles.
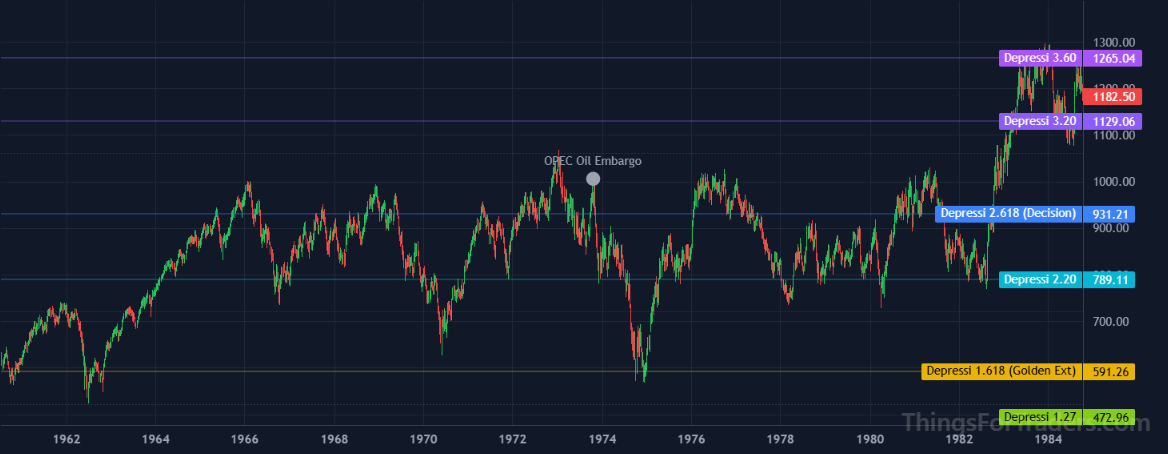
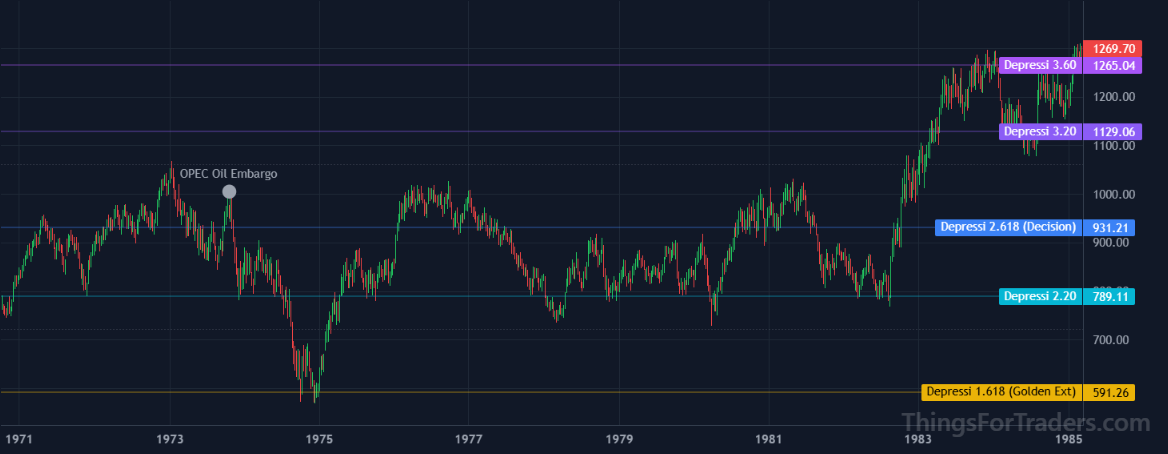
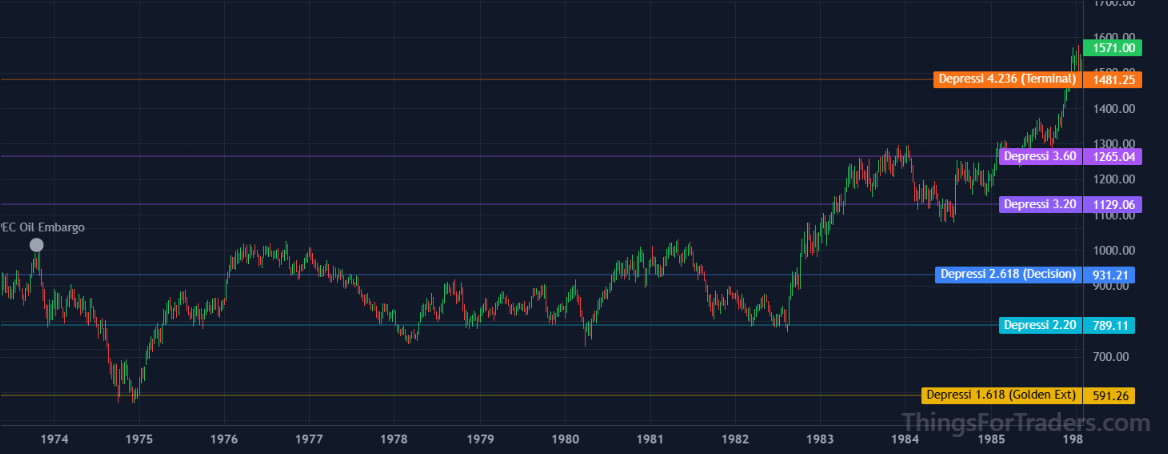
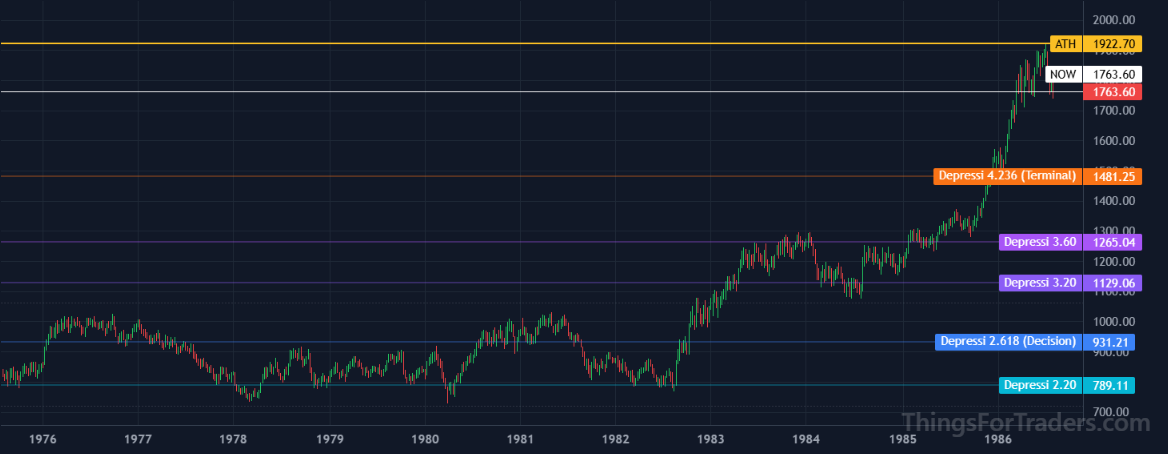
- October 1982: 2.618 level (approx. 938) decisively broken; acceleration follows immediately.
- 1983: 3.60 extension (approx. 1,274) reached; brief stall then through.
- Mid-1980s: 4.236 level (approx. 1,492) cleared with no meaningful resistance.
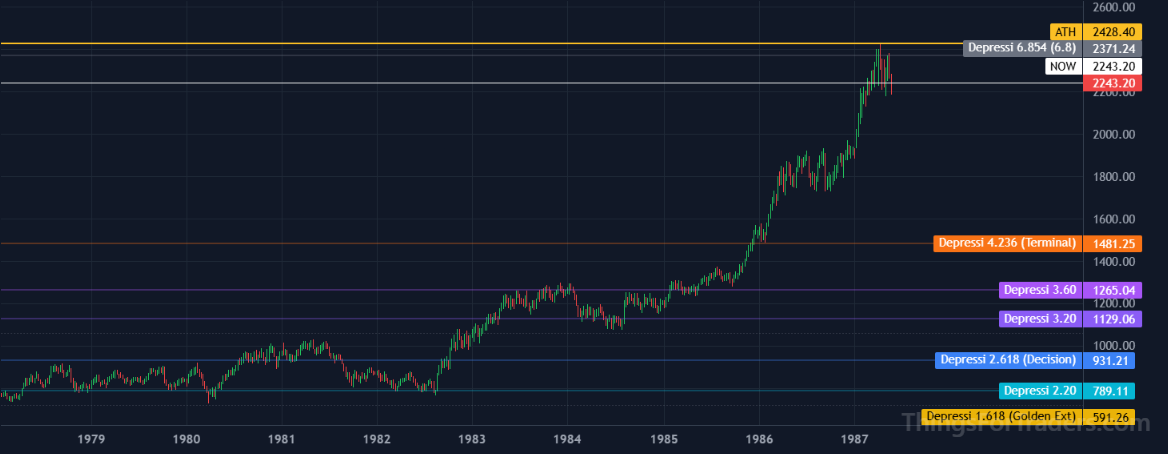
- Spring 1987: 6.80 extension (approx. 2,368) reached; price overshoots to the August peak near 2,722 before the crash.
- October 1987: "Black Monday" crash terminates near a full retest of the 4.236 level.
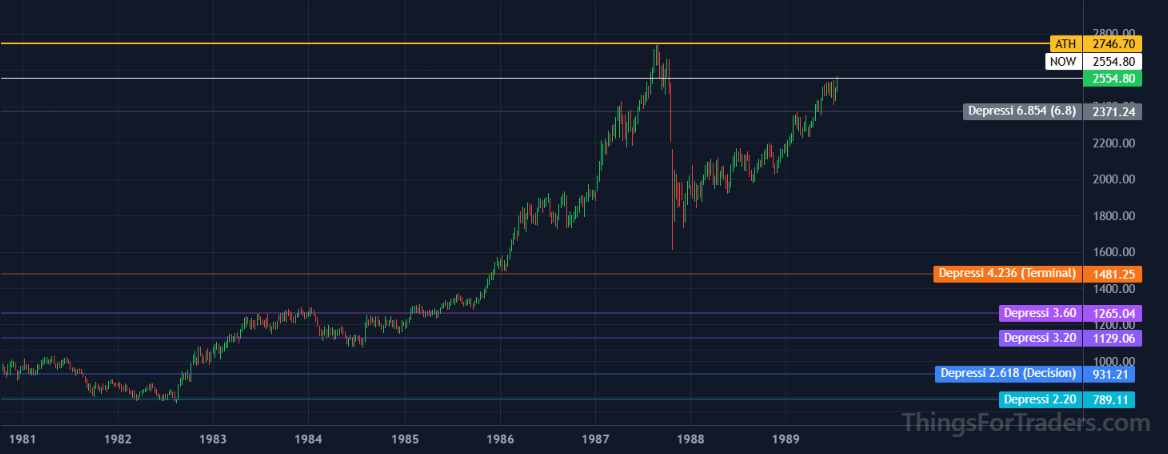
The 1987 crash was attributed in contemporaneous analysis to computerised program trading. Structurally, the peak was derivable from the 1932 anchor 50 years prior, and the crash low aligned with the 4.236 retest, echoing the ending sequences seen in prior cycles. The 1987 swing (August high to October low) now becomes the primary input for the next anchor cycle.
Anchor 2: The 1987 Crash Cycle (1987–2007)
- Symbol:
- DJI Weekly
- Anchor High:
- 2,722.42 (August 1987 Peak)
- Anchor Low:
- 1,738.74 (October 1987 Crash Low)
- Range:
- 983.68 points
Phase 1: The 1.272 and 1.618 Phases (1990–1994)
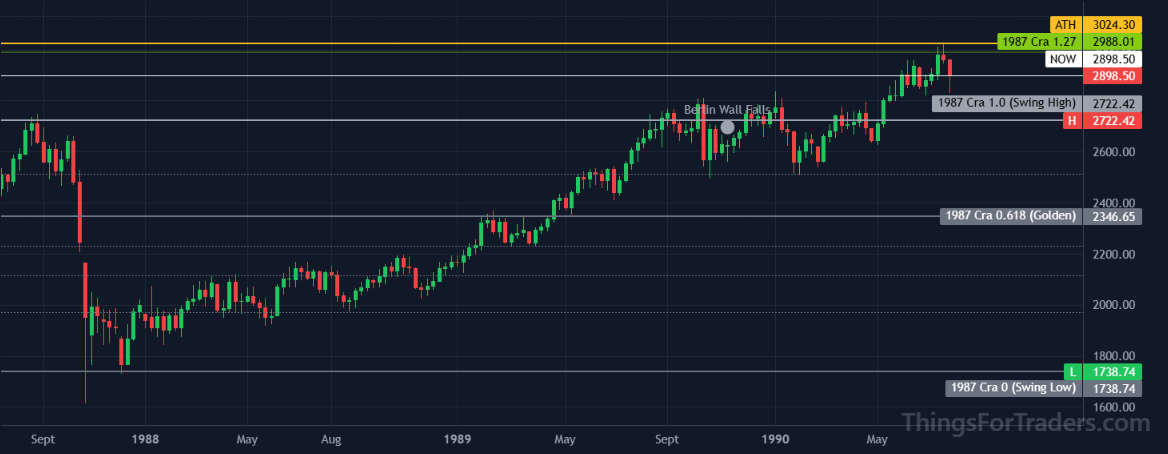
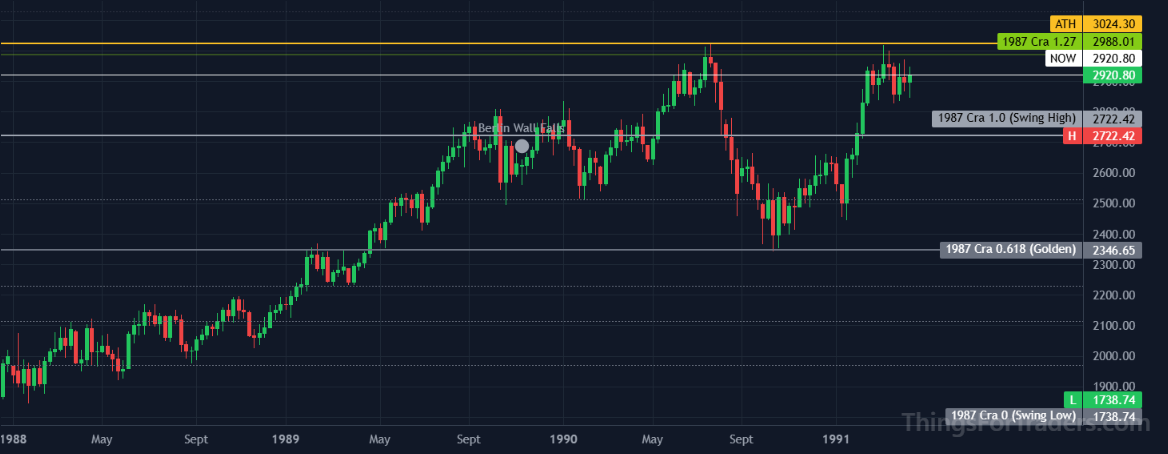
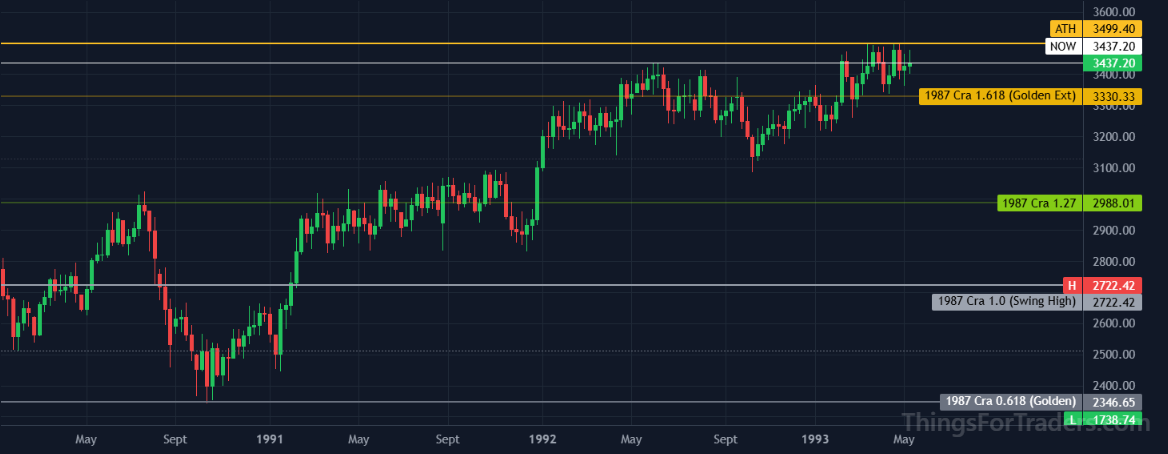
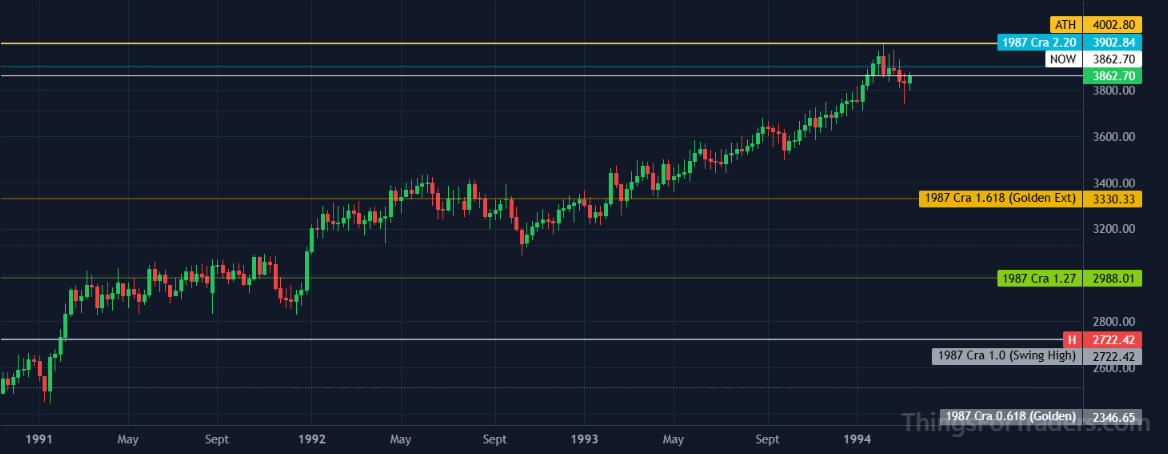
- July 1990: 1.272 extension (approx. 2,989) reached; sharp weekly correction consistent with prior 1.272 interactions.
- January 1991: Correction low near 0.76 level (approx. 2,487).
- Early 1990s: 2.20 expansion (approx. 3,330) reached; multi-year consolidation phase begins.
- Late 1993: Definitive break above the 1.618 level.
Phase 3: Mid-Cycle Expansion and the 2.618 Break (1995–1997)
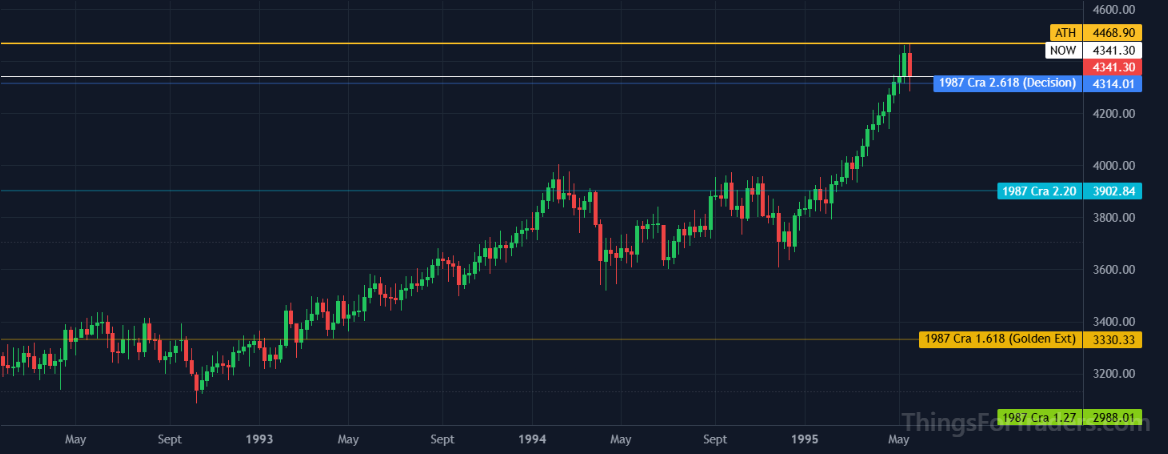
- 1995: 2.20 level (approx. 3,902) cleared without significant hesitation.
- 1995: 2.618 extension (approx. 4,314) reached.
- 1995–1996: Decisive break above the 2.618 ceiling; over-performance phase begins.
Phase 4: Parabolic Acceleration to the 4.236 (1997–2000)
The late 1990s Dot-com era contains the parabolic acceleration characteristic of 4.236 expansion targets in prior cycles.
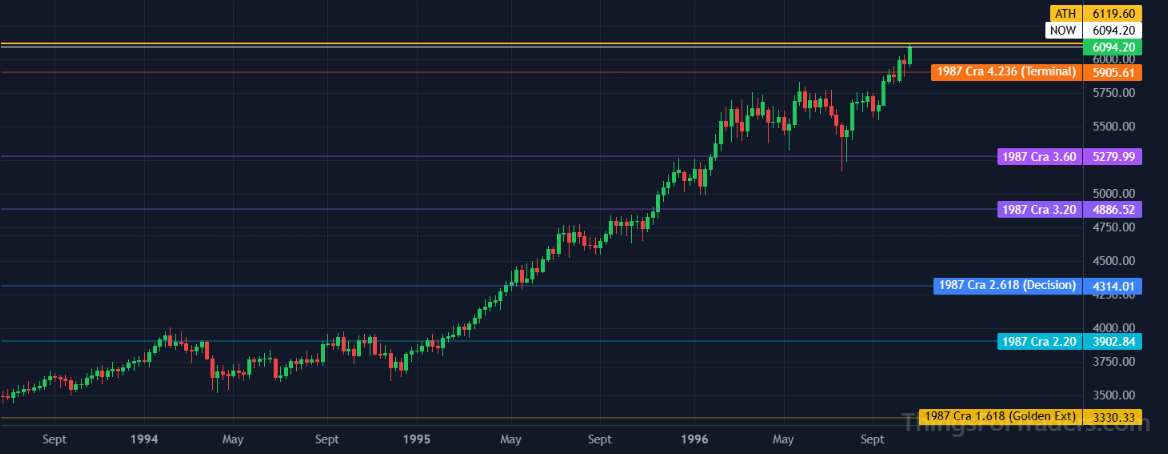
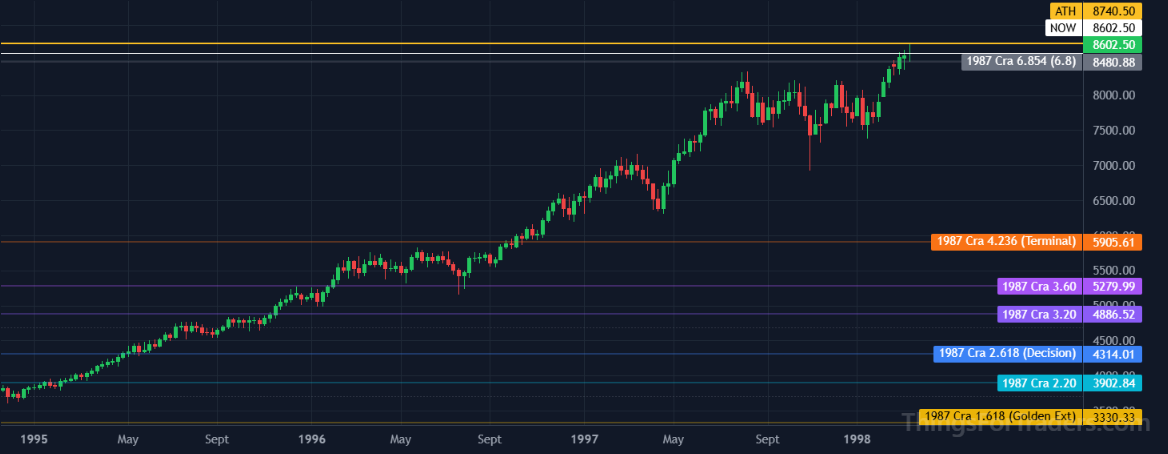
- Late 1996: 4.236 extension (approx. 5,906) initially reached. The Federal Reserve chairman uses the phrase "irrational exuberance" this same month.
- 1998: Asian Contagion correction. The 4.236 level acts as a structural pivot during this event.
- End of 1999 / early 2000: The index extends significantly above the 1987-anchor 4.236 as the Nasdaq bubble peaks.
- 2000–2003: Dot-com bust. The correction navigates near the 1987-anchor 4.236 before a recovery.
- February 2009: The 1987-anchor 4.236 is retested at the GFC crash low. This completes the ending sequence for the 1987 cycle.
The 1987 anchor cycle is the first in this series where the 6.80 level was substantially exceeded and the final crash low did not produce a clean 4.236 retest in a single move. However, the primary extension levels continued to function as structural reference points throughout, and the broad pattern — 1.272 reaction, 1.618 consolidation, 2.618 over-performance trigger, 4.236 area as late-cycle pivot — remained consistent with the model. With the GFC swing providing a confirmed major correction, the 2007–2009 high-to-low becomes the next anchor.
Anchor 3: The GFC Anchor Cycle (2007–Present)
- Symbol:
- DJI Weekly
- Anchor High:
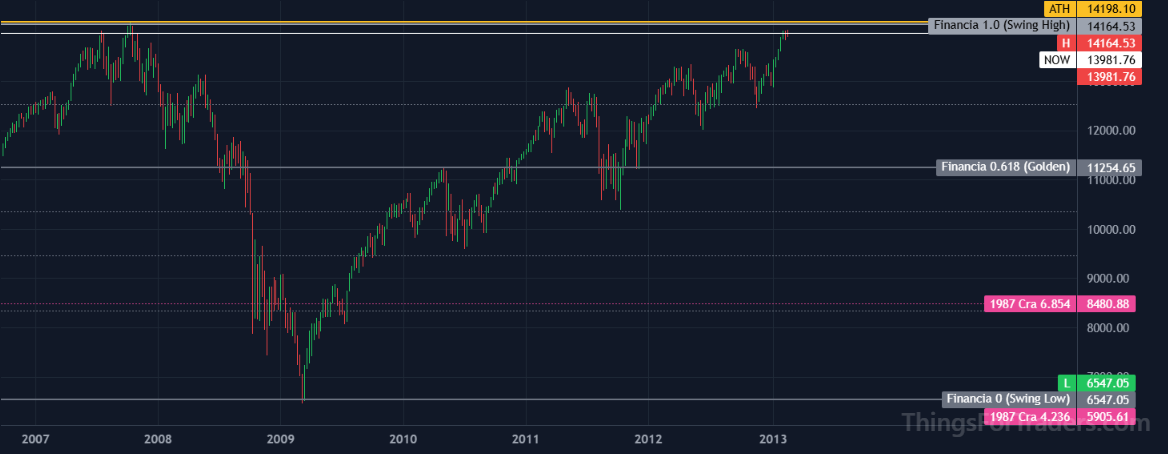
- 14,165 (October 2007)
- Anchor Low:
- 6,547 (March 2009)
- Range:
- 7,618 points
The GFC swing represents one of the most structurally significant anchor inputs in modern market history. The following sequence documents the expansion of the DJI from the 2009 low against the Fibonacci extension ladder derived from the 2007–2009 collapse.
Phase 1: Reclaiming the 1.0 and 1.272 Extension (2013)
Per prior anchor cycles, the reclaim of the anchor's 1.0 level (the prior swing high) initiates the expansion ladder.
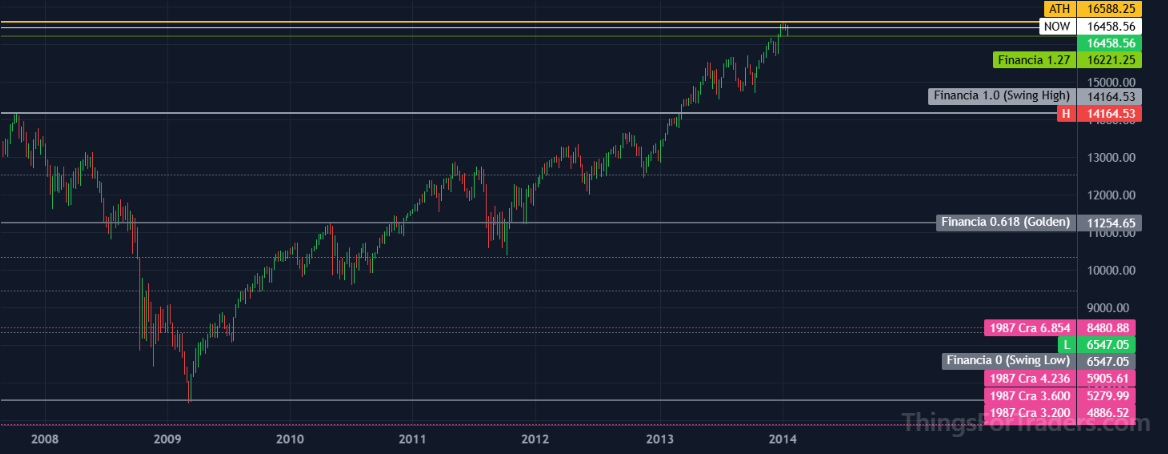
- 2013: DJI reclaims the 1.0 level (14,165). Breakout immediately targets the 1.272 extension (approx. 16,221), consistent with model norms.
Phase 2: The 1.618 Consolidation (2014–2016)
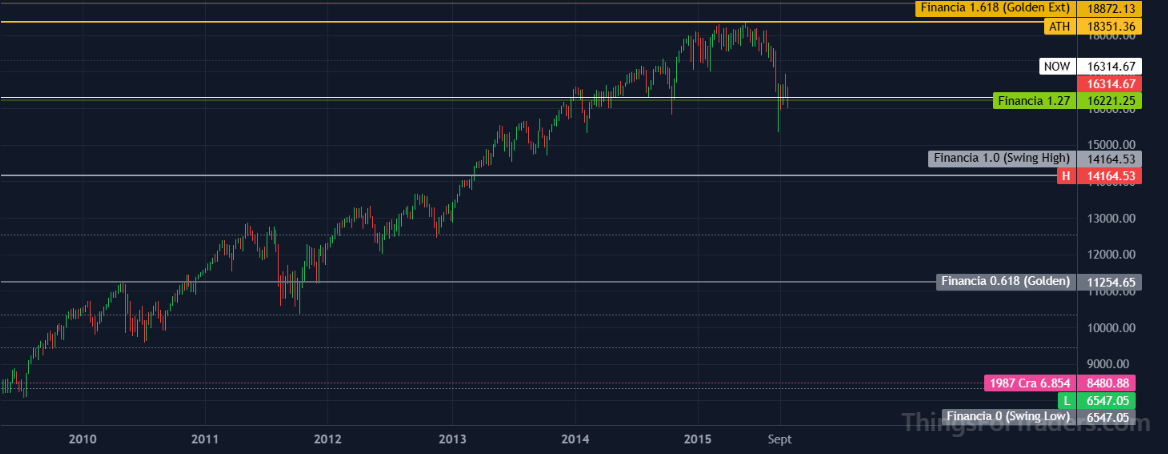
- 2014–2015: 1.618 extension (approx. 18,872) reached; approximately 18-month sideways consolidation begins.
- August 2015: 1.618 retested and holds as support.
- January 2016: 1.618 retested a second time; clean hold. The subsequent rally from this level is notably sustained.
- November 2016: 1.618 definitively broken to the upside.
Phase 3: The 2.20 to 2.618 Decision Phase (2017–2020)
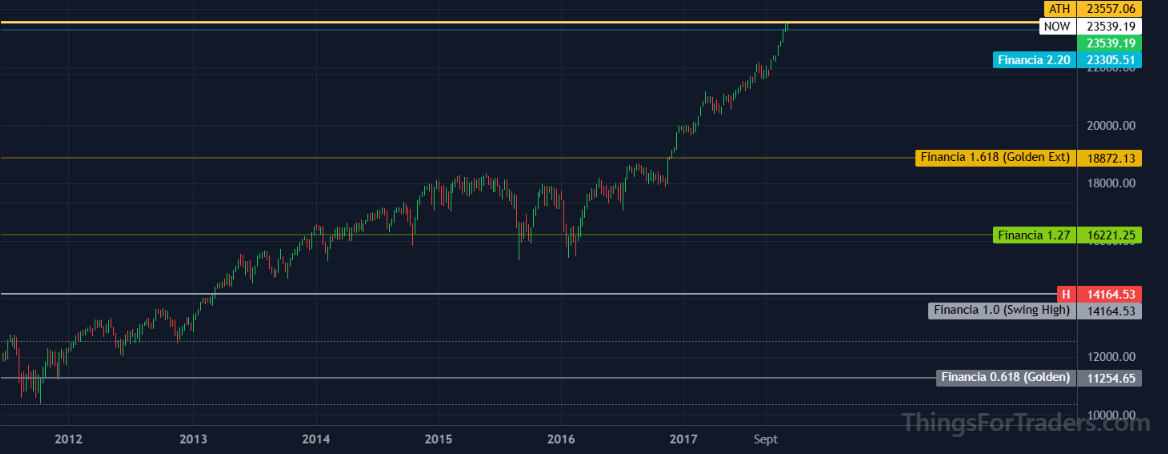
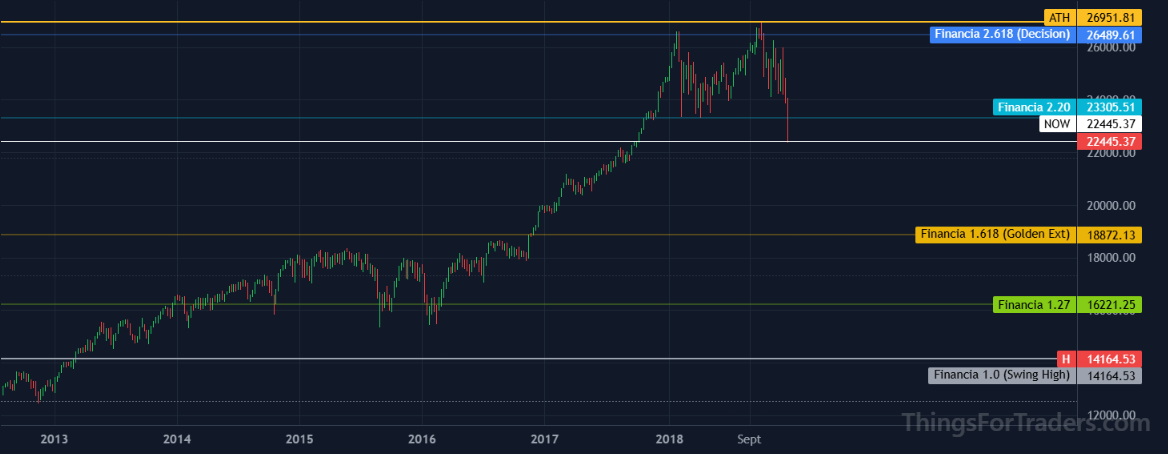
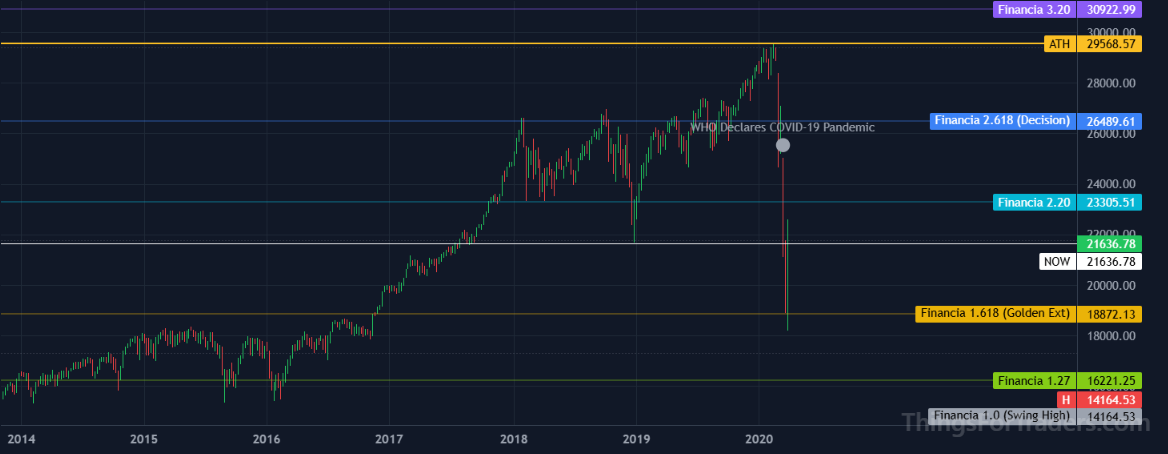
- 2017–2018: Price clears the 2.20 (approx. 23,306) and reaches the 2.618 Decision level (approx. 26,490). A multi-year broadening formation and elevated volatility follows.
- January–December 2018: Correction from the 2.618 ceiling to the 2.20 floor. The Volmageddon event (February 2018) occurs within this range.
- 2019: Q4 2019 decline stops just under the 2.20 extension (approx. 23,306).
- October 2020: 2.618 reclaimed and retested as support; the second break is validated, initiating the over-performance phase.
The 2018–2019 broadening formation at the 2.618 level, including the Volmageddon event (February 2018), can be read as an extended 2.618 decision zone. The Q4 2019 decline stops just under the 2.20 extension (approx. 23,306), maintaining structural integrity before the COVID-19 crash broke decisively through the 2.20 and retested the 1.618 floor (approx. 18,872).
Phase 4: Acceleration Through the 3.60 and 4.236, Toward the 6.80 (2021–Present)
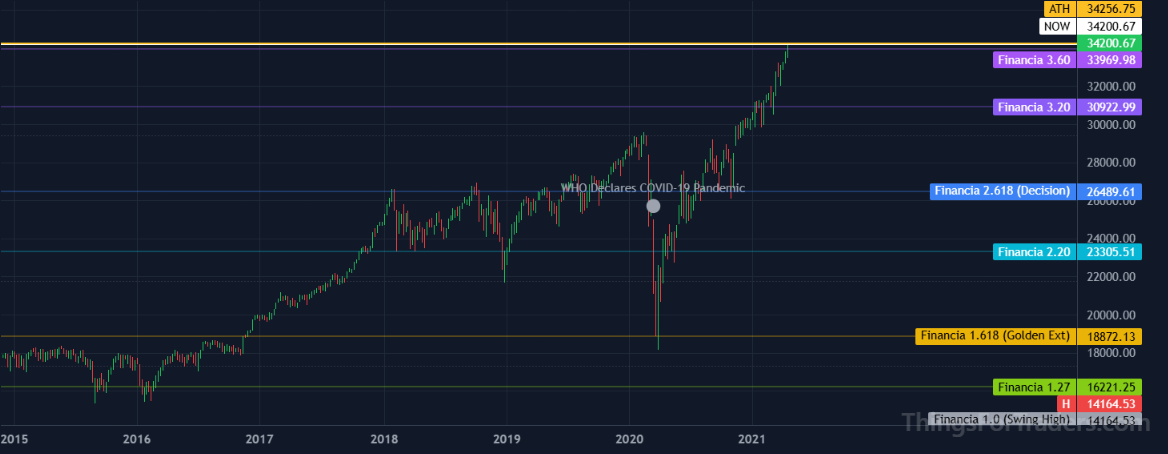
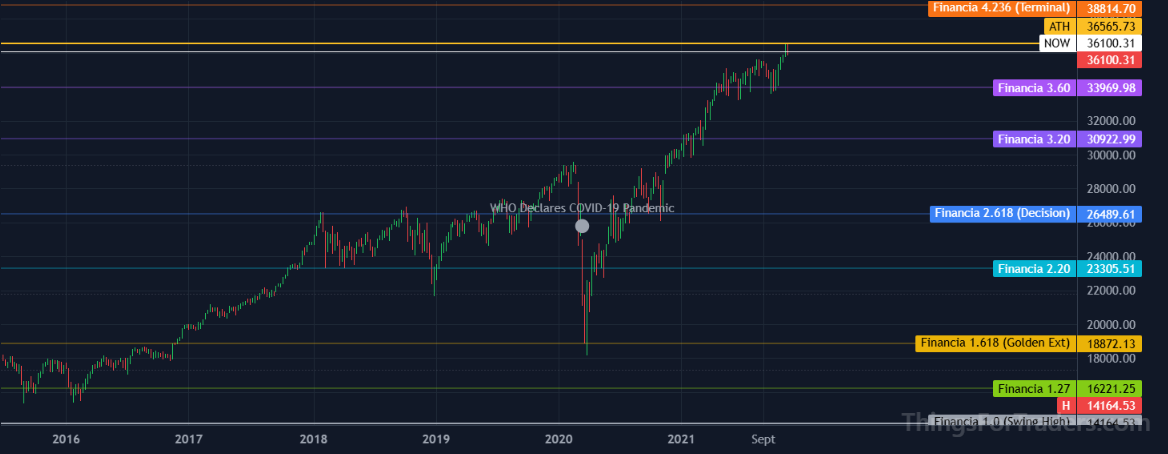
- 2021: Price clears the 3.20 (approx. 30,923) and reaches the 3.60 extension (approx. 33,970).
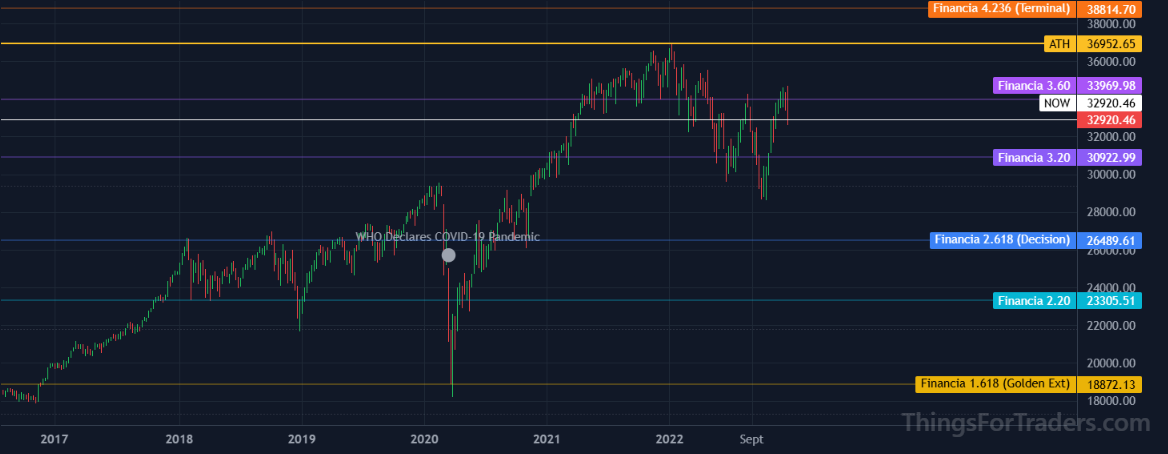
- 2022–2023: 3.60 level (approx. 33,970) acts as repeated weekly support during mid-cycle consolidation.
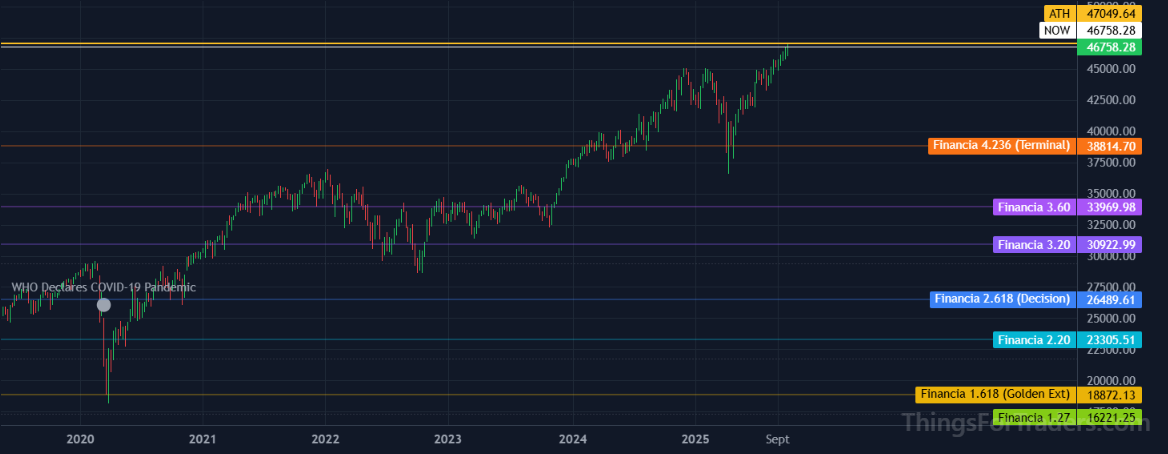
- December 2023: 4.236 extension (approx. 38,815) reached.
- 2024–2025: 4.236 cleared; price continues higher rather than turning here.
- Mid-2026: DJI near 53,300 — about 37% above the 4.236 and roughly 9% below the 6.80 extension (approx. 58,350).
Longitudinal note: the GFC anchor shows the same ladder levels acting as structural reference points. The 1.618 level (approx. 18,872) acted as the 2020 crash floor. The 3.60 (approx. 33,970) acted as the 2022–2023 mid-cycle pivot. The 4.236 (approx. 38,815) was reached and then cleared. It is worth being precise about what the 4.236 is and is not: in none of the three cycles is it the level at which the expansion ended. Measured against each anchor's own range, the 1929/1932 cycle topped in 1987 around the 7.8× extension; the 1987 cycle topped in 2000 around the 10× extension; and the GFC cycle has, so far, carried past its 4.236 and is extending into the upper ladder. Every completed cycle in this series reaches at least the 6.80 and then runs further. The 4.236 is a waypoint — a level expansions pass through, sometimes pausing at — not a terminal.
Cross-Cycle Summary
Recurring structural pattern across all three anchors:
- The 1.272 level produces the first notable corrective weekly reaction after the initial recovery from a crash low.
- The 1.618 level acts as a multi-year consolidation gate; the market stalls here for an extended period before a decisive break, after which the next major tier is targeted.
- The 2.20–2.618 band functions as a decision range; oscillation within this band, with the 2.618 repeatedly failing, precedes an over-performance trigger.
- Once the 2.618 is cleared on a weekly basis, a high-momentum acceleration phase toward the 4.236 follows with minimal structural resistance.
- The 4.236 is a waypoint, not a cycle end: in this series every expansion clears it and continues. Once it is cleared, a parabolic move toward the 6.80 tends to follow, and the cycle high has consistently landed beyond the 6.80 — near the 7.8× extension in 1987 and near the 10× extension in 2000. The 6.80 is best read as a level every cycle reaches at minimum, not as an upper bound.
- The 1.618 from the current cycle tends to act as major structural support during crash events that occur within the expansion phase (e.g., 1970 and 1974 crashes at Depression-anchor 1.618; 2020 COVID crash at GFC-anchor 1.618).